Learning Goals
Students will learn introductory level concepts about binary exploitation. This project is designed to develop your understanding of control flow hijacking through different tasks/challenges showcasing select vulnerabilities or weaknesses in compiled binaries. By the project’s end, you should…
- …be familiar with simple C syntax and assembly operations.
- …able to identify common memory-based vulnerabilities.
- …capable of crafting basic exploits from scratch
Tools you will use
- Python – While you are welcome to craft your exploits using other tools/frameworks, in this project we teach to using Python and the
pwntoolslibrary for automating/scripting our exploits. - GDB – The GNU Debugger is a useful tool for understanding the underlying behavior of a program during runtime. We have extended its native capabilities with the
pwndbgplugin for additional output and readability. - objdump – The
objdumptool will allow us to disassemble the compiled binaries, affording us an opportunity to perform static analysis of the binary’s instructions at a more granular level than what the C source code alone can. - ropper – A useful tool for identifying so-called “gadgets” to facilitate return-oriented programming (ROP). Additional information concerning what ROP and gadgets are will be covered in the appropriate sections of the project.
Recommended Reading
To deepen your understanding of binary exploitation, consider reviewing:
- The
~/project/tutorial/README.mdand the associated follow-along code. - The project tutorial videos:
- explaining some rudimentary basics of Computer Architecture
- on how the Stack and Function Calls work in C
The final deliverables:
A single JSON-formatted file will be submitted to Gradescope. This file should be named project_binexp.json. A template can be found on the Submission Details page.
Project Environment
This project runs in an OVA-formatted Virtual Machine (VM) with all the binaries/tools required, and must be used to generate the correct flags. We recommend running the VM through Oracle’s . Login credentials for the VM to access the project’s materials can be found through Canvas.
TABLE OF CONTENTS
Welcome to the Binary Exploitation (BinExp) project for CS6035! We’re excited to have you with us for this effort.
Binary exploitation is a really interesting and challenging domain within cybersecurity. It rests at the intersection of many sub-disciplines, including reverse engineering, low-level programming, operating systems, code review, etc. You’ll be expected to draw upon a variety of subjects matter in approaching and working through the challenges of this project. Understandably, many students find the project challenging at some point (or many points), due to the need to perform additional research in those areas on top of working the problems themselves; as such, we encourage you to not delay in getting started with the project!
Each stage within this project presents a set of learning objectives and associated challenges. We’ve endeavored to present these challenges in a logical order in the form of “Stages”, starting here in Stage 00 as a guided introduction to the project through to Stage 04 where you’ll be crafting your own novel exploits to some unique challenges. Within each stage, there are a number of exercises affiliated with the related material ranging from “easier” content (prefixed as 01, such as 01_basic_overflow_1) to more challenging tasks (difficulty 03). While we encourage students to proceed through the challenges in-order if you’ve never done anything like this before, you are welcome to approach this projects’ challenges in any order you’d like; in fact, if you’re stuck on an exercise it may be best to move along and return back later.
Learning Objectives
The learning objectives for this section are:
- Project setup and understanding the project architecture
- High-level introduction/exposure to project materials
- Validation of project infrastructure, including:
- Environment setup
- /proc/flag
- Gradescope
Exercises
This section features 1 exercise:
01_basic_overflow_1
Step A.1
Before diving in, let’s ensure that our project environment is appropriately configured.
- This project utilizes the same virtual machine (VM) that is used for other projects within CS6035. If you’ve already got it configured, great! If not, see the respective “Course VM Download Thread” post in Ed Discussion for instructions.
- Please follow the instructions in Canvas (navigate to “Assignments” > “Binary Exploitation”) for login credentials to the VM as well as the requisite commands for fetching the project files.
- Navigate to
/home/binexpopen the user.txt file (this file will be empty initially) and enter your nine-digit GTID. If you do not know your GTID, you should be able to discover this through . Note: if you fail to set this, no responses you submit to Gradescope will be accepted as correct.
Below is a brief summary of the project’s contents:
project_binexp.json: This is the one (and only) file you will submit to Gradescope to have your work be evaluated. See theSubmissiontab along the left-hand side of this page for additional guidance concerning project submission guidelines.project\*: This is the directory and subdirectories that make up the project. Each subdirectory reflects an individual challenge within the project and contains all of the files necessary for solving that particular challenge. We have included aproject\tutorial\subdirectory that has amplifying guidance material to help get you oriented to the projects’ techniques. The contents ofproject\tutorial\are not mandatory or graded – you should not include any practice work results you perform there in yourproject_binexp.jsonfile.project\*\flag: For most of the challenges, this is the compiled binary you’re attempting to exploit. If it isn’t, the student instructions for that particular challenge will say so.project\*\flag.c: This is the source code for theflagbinary, above. This is intended to be a useful reference to aid in identifying and crafting your exploits offlag.project\*\e.py: This is a python3 script with some templated skeleton exploit code. You are welcome to use/ignore this as you see fit.project\*\e.py.bak: This is just a copy of the initial state ofe.pyin case you accidentally delete it or wish to revert back to start. Simply copy from this file to get a clean-slatee.py.
In all of the projects’ binaries, your goal is to have the binary read from /proc/flag! Most of the time, this is via a system() call like:
system("cat /proc/flag");
However, sometimes it’s not that simple – carefully analyze your source code within each challenge to figure out how the binary is meant to read from /proc/flag.
Step A.2
01_basic_overflow_1 [0 pts]
INSTRUCTIONS
Now, let’s take a look at our first introductory challenge to ease us into the exploit development process at a high-level: 01_basic_overflow_1. We’re going to walk you through this one just to give you a sense of what’s to come.
In this task, we’re looking at a simple . A buffer overflow occurs when input exceeds the expected bounds it’s intended to write to, thereby spilling outside those bounds and overwriting other areas of memory. Generally speaking, this kind of incident leads the running process to crash. However, a crafty (and determined) malicious actor may be able to get the process to do something else altogether!
If we were to review the source code for our binary (flag.c), we could start by tracing the code execution flow starting at main(), which is the starting point for all C program code.
cat ~/project/01_basic_overflow_1/flag.c
- The
main()function starts by initializing the variablemake_me_not_zeroto 0. - It then declares an int
bufferof size 300. - There’s a
printf()call, which would write some instructions to the user tostdout. - The process then blocks for user input with
scanf(), writing the input tobuffer. - There’s then a if-conditional check to see if
make_me_not_zerois still 0. If it is, the process terminates; if it isn’t, we arrive at our desired destination in the binary which reads our flag out for us.
Intuitively, we can start to build our attack chain in reverse:
- We want to get to the function call that reads out our flag.
- To get to the above, we need to have
make_me_not_zeronot be zero by the time the if-conditional evaluates. - Since the program does not otherwise allow for us to set
make_me_not_zero, we need to either overwrite it in memory or otherwise disrupt the control flow of the process. - Our only input to the process is along the
scanf()call, so we’ll investigate what exploit opportunities exist around here.
Now many of you may not necessarily be professional exploit developers already (in fact, some of you may not have exercised secure coding practices in C more generally); understandably, the vulnerability may not immediately be apparent. But if we look into references for , we can see that it reads in from stdin with the “s” specifier standing for…
Any number of non-whitespace characters, stopping at the first character found…
“Any number of non-whitespace characters”?! But buffer only allocates for 300 int (300 * 4 bytes)! This adds affirmation to our above-described attack-chain that a buffer overflow may be possible.
OPTIONAL: TRY USING E.PY!
Let’s test our assumptions! Open e.py and take a minute to look it over. When you’re ready, uncomment the following line:
payload = b'A' * 1209
…and then run it from the 01_basic_overflow_1 directory with our dbg option:
python3 e.py dbg
Assuming you’re running this in the VM, you should see another terminal open running GDB with the pwndbg extension. Don’t worry too much about understanding what’s happening here for now; we have several exercises coming up in other stages that dive into all of this. In brief, you’ve launched a debugger and hooked it onto the flag process; that process has ran and is now paused at the start of the main() function. For now, enter “c” or “continue” and let the process resume running.
GDB will likely halt again, throwing a SIGSEGV segmentation fault. Examining the BACKTRACE log panel will show that our main() function successfully made the subsequent function calls necessary to read out the flag; there will also be error messaging informing you of your test’s success – though specifying you need to run your exploit outside of GDB. For us to do that, we’d want to re-run e.py without the ‘dbg’ option like so:
python3 e.py
Make sure you’ve uncommented the payload line, or it won’t work!
Again, don’t worry too much right now about understanding all of the information that GDB is showing you. We’ll go more in-depth with that in the section(s) to follow. For now, go ahead and close the GDB window (or type in “q” or “quit”).
Step A.3
Having developed our attack chain as a thought exercise and (optionally) affirmed our assumptions through GDB, we can now move on to exploiting the binary for our flag.
Using either e.py or the command line, run flag and pass at least 1209 characters to the program and receive your flag. Note if you run your exploit multiple times, you will get a different value each time. This is expected behavior and nothing to worry about.
Now enter that hash into your project_binexp.json file and submit it to Gradescope to confirm you’ve correctly walked-through the initial setup! Again, if you’re uncertain about the format for what project_binexp.json should look like, see the Submission tab to the left.
Common Pitfalls
Overview
In this part of the project, we’re going to focus more narrowly on some of the foundational aspects that undergird binary exploitation more generally. We’ll look at Intel x86 Assembly, using our tools like GDB to evaluate runtime statuses, and look to solidify our comprehension with the project environment before launching into the more exploit-centric material to come.
Learning Objectives
The core learning objectives for this section are:
- A baseline familiarity with Intel x86 Assembly.
- Utilizing GDB.
- C programming language comprehension.
Exercises
This section features 2 exercises:
01_bb_steps02_assemble_the_assembly
Step B.1
Why are we interested in Assembly at all?
When you compile a source code file (such as flag.c), the compiler (like gcc) translates the high-level human-readable code into machine code that the computer’s processor can execute. A number of operations are performed at compile time (such as optimizing and linking), which obfuscates the binary’s original source code. However, we can still use a disassembler (like objdump) to translate machine code back into lower-level assembly instructions.
In practice, exploit developers generally do not possess the original source code of the binaries they research. But they can utilize tools to pour over and examine the assembly instructions – which can be just as good (provided you know how to read/contextualize assembly). Understanding what these assembly instructions are doing – both individually and collectively – is a fundamental baseline for reverse engineering (and by extension, exploit development).
NOTE: there are also tools that can “de-compile” binaries; these take the translation a step further by attempting to recreate the source code from the disassembled instructions. However, this is often incomplete and – in some cases – inaccurate. We do not supply you with a decompiler tool in this project because we provide you with the original source code. We’ve also compiled all our binaries in gcc with the -g flag, which produces debugging info in the OS’ native format that GDB can use to rebuild the source.
Being able to read and comprehend assembly is often a labor-intensive process, especially if you’ve primarily been exposed to only higher-level languages before. We encourage you to lean into this challenge, however. Without fostering this aptitude, you’ll often be left in a position of brute-forcing/guesswork (being unsure what a process is doing or why your exploit is behaving a certain way).
If this is your first time seeing/engaging x86 Assembly be forewarned that you’ll need to be a quick study for this project. This section’s exercises are meant to help orient you more generally, but the sections to follow will require a firm understanding if you want to avoid getting lost.
In the table below, we’ve listed some of the common instructions you’ll encounter in the course of this project. At a high-level, assembly operations (e.g. mov, xor, ret, etc.) may have 0, 1, or 2 “arguments” to them depending on the particular operation – these arguments are referred to as “operands”. Depending on the instruction, the operand may be a value, something referential to the stack/heap, or a register. We encourage you to consult other reference material as needed to foster your comprehension.
Why are we interested in CPU registers?
Registers are part of a CPU’s architecture and are used to store data and perform operations. Assembly instructions make use of registers all the time (and by extension, the stack and heap – topics for another section). In the setup exercise (basic_overflow_1), you may have observed some of the registers and their contents at runtime within the GDB debugger like so:

In the above screenshot, the various R* values (RAX, RBX, RCX, etc.) in red along the left-hand side denote the CPU registers. The values immediately adjacent to them reflect what is presently stored in them. You’ll see that sometimes the register can hold referential addresses which point to other locations in memory (see RAX, RBX, RDX, RSI, etc.) whereas others contain the value itself (e.g. RDI, R8, R11, etc.).
You can always query the current value of a register in GDB. For example, let’s say we wanted to view the contents of RDI:
pwndbg> x $rdi
Throughout this course, you’re going to be working with 64-bit registers. Besides being different in size from 32-bit registers, there’s actually some important architectural differences that you’ll need to know as they relate to binary exploitation. More to-the-point, not all registers are used in the same way by the CPU. Function calls – for example – look at specific registers for things like function arguments. For now, we encourage you to perform independent research into RBP, RSP, and RIP as these will be very important in the sections/exercises to follow.
Step B.2: Exercise 1
01_bb_steps [5 pts]
Version: 51314d324d444d3149464e316257316c636941794d444932494735316247773d
Resources
- See our
- https://www.cs.uaf.edu/2017/fall/cs301/lecture/09_11_registers.html
Challenge Instructions
This challenge is meant to be a soft introduction to using GDB; however, you are also welcome to calculate the values by hand in reading the source code (flag.c) if you so choose. We recommend using GDB if you have never done so before because of how extensively the remaining project exercises engage the tool.
We can begin by manually starting GDB and hooking it to the flag binary process like so:
cd ~/project/01_bb_steps/
gdb flag
We have extended the default vanilla GDB tool with in order to help with things like readability and utility. If you were instead to invoke the binary into GDB with e.py (python3 e.py dbg), you’d observe GDB open as a separate window (see FAQ for folks opting to SSH into the VM). Either way, the pwndbg prompt will wait for you to enter a command; let’s start by setting a breakpoint for the debugger to catch on:
pwndbg> b main
The above sets a breakpoint at the start of the main() function (Note: as a courtesy, all of your e.py files have this configured by default when you invoke the dbg option). Recall that all C-based programs start execution at main(), so we can reliably expect such a function to be present in all of our binaries for this project. Let’s now start the flag binary by running it:
pwndbg> r
Within the GDB interface window, you’ll likely see a flurry of text/blocks showing various things like stack traces, register printouts, code prints, and more. GDB will pause the process’ execution at the start of main() (where we set our breakpoint) and await for the next command.

If you look at the DISASM readout, you’ll note that we’re not quite yet where we want to be. Let’s go to the next instruction, call bb_steps:
pwndbg> ni
The call instruction makes a function call, in this case to the bb_steps() method. If we were to use n or ni now, we’d step over this to the mov instruction at 0x401295. We want to follow the control flow into bb_steps() instead, so we’ll step inside using:
pwndbg> si
After that, you will notice we are now in the bb_steps() function. We can now make larger “next” (n) steps (vs. the more granular “next instruction” or ni) which will traverse the code flow faster by logical instruction blocks. Go ahead and see how this progression synchronizes with the SOURCE (CODE) display readout until you hit the scanf() method.
You can (and should) also take some time to observe the changes in the registers that are taking place with each __asm() line from the source code.
pwndbg> n
At the end of the ASM instructions, you will be prompted to enter in answers for a couple of questions based on what you can read out from GDB. You can enter these into GDB if you want to; however, in order to get the official/valid flag for submission you will have to save your answers, exit GDB, and then enter them into a non-debug binary run, e.g.:
binexp@cs6035:~/binexp/01_bb_steps$ ./flag
What value is currently in RBX?: 0x<valid_answer_here>
Upon correctly answering the questions, you will see your flag printed out, which you can copy into the json file!
Common Pitfalls
Step B.3: Exercise 2
01_assemble_the_assembly [5 pts]
Version: 51314d324d444d3149464e316257316c636941794d444932494735316247773d
Resources
- https://www.felixcloutier.com/x86/
- https://en.wikipedia.org/wiki/X86_instruction_listings
Challenge Instructions
This challenge will have you determine which series of assembly instructions will direct the code flow into constructing a call that will get the flag. As the challenge name implies, you get to pick the instructions from a limited menu of options that can lead to that outcome.
As the more difficult challenge, guidance for completing this challenge will be a bit more sparse and require you to lean on what you’ve learned thus far to accomplish the task. However, there are some things worth highlighting:
One of the first things you’ll want to do is figure out the target address you want to go to. Try reading the source code (flag.c) and seeing where – logically – that might be; where in the source code is the program making a call to read from /proc/flag? When you’ve identified what looks appropriate, try dumping the instruction set for the binary using objdump:
objdump -D flag > flag.asm
You can then read/search/parse through the generated flag.asm file to look for an appropriate address that lines-up with where you want to go; try looking for the function name(s) to help narrow down your search.
Alternatively, you can use GDB and query the addresses directly (much like we did with the register state up at the top of this section).
Once you find your address, you need to determine what subset of instructions would be necessary (and in what order) to get there and – ultimately – return your flag!
Common Pitfalls
“Is this a buffer overflow exercise?”
No.
“What kind of input is assemble_the_assembly looking for?”
If you’re uncertain about what the binary’s expecting, we would direct you to the `flag.c` source code. If your input does not match one of the supplied switch cases, then it lands into the default case and executes that.
“Do I need to use all of the switch case statements?”
No, you do not. If you get stuck, you might be interested in knowing that there are several different (but valid) combinations available that would result in the binary giving you the flag. Try to understand what the operations are doing (vs. blindly guessing).
Overview
Now we get into the meat-and-potatoes of the binary exploitation project!
Recall in Stage 0 what we did in the guided exercise of 01_basic_overflow_1: we learned how C could be a memory-unsafe language. More to-the-point: we performed a buffer overflow, thereby overwriting a variable (which altered the code flow of the process). It turns out that this kind of vulnerability can extend to overwriting other areas of the execution stack as well. In this section, we’re going to have our first look at stack-based overflows and learn the building blocks that will enable us to tackle more challenging exploits.
Learning Objectives
The core learning objectives for this section are:
- Understanding the stack and stack-smashing comprehension
- Working with pwntools and basic exploit development
- Foundational considerations for code flow redirection
Exercises
This section features 3 exercises:
01_basic_overflow_201_deja_vu02_the_server_client_one
Step C.1:
What is the stack? Why do we care about it?
In computer science, the stack is a contiguous block of allocated memory. As functions get called, said function’s variables get memory allocated on the stack; as the function call is resolved, the memory for the variables are de-allocated and removed. Helping organize and control this process are the RBP and RSP registers, which store the base pointer and stack pointer values, respectively. These pointers help reference either end of the stack frame and are useful both for pushing/popping values on/off the top of the stack (RSP) or referencing local variables (RBP).

For the purposes of binary exploitation (and by extension, this project), this is useful to us in a lot of different ways. We’ve already seen how overflowing the stack can allow us to overwrite local variables contained within that particular function’s stack frame; but the real utility from this comes from writing into other stack information.
Consider what was described above: when a function call is resolved, it executes a ret assembly instruction to return the execution flow back to wherever it was originally invoked from: that destination is preserved in the stack! Since we’re already overflowing other values in the stack, we can likewise overwrite the destination that the ret instruction goes to!

What’s the danger?
Now all of the above can feel quite abstract – especially if you’ve only ever learned about buffer overflows (or similar memory-based attacks) in academic textbooks. But there’s actually substantial security risks in being able to hijack a process’ control flow at runtime.
In all of the exercises that follow, we merely direct you to exploit the binary into reading from /proc/flag. But we could – in theory – make these binaries do anything we wanted under the EUID of the process (binuser); that’s not particularly useful/threatening in our case (since binuser has similar privileges as the user you’re already logged in as, binexp), but imagine the risks that poses for a vulnerable process running under elevated privileges; if we were to exploit a process running as root (or Administrator, in Windows parlance), we could force the process to perform actions as root. This goes without even addressing the potential harms to what the software itself is responsible for (one could only imagine the potential impacts that could happen to software responsible for payroll or critical infrastructure, for example).
And before you go writing buffer overflows out as yesterday’s news – .
Again however, we’re not going to be going that far in this class; these exercises are merely meant to get us acquainted with this class of vulnerability and comfortable with exploiting it at a basic level.
Step C.2: Exercise 1
01_basic_overflow_2 [5 pts]
Version: 51314d324d444d3149464e316257316c636941794d444932494735316247773d
Resources
- See our
e.py(see the Instructor’s Note in the code comments)
Challenge Instructions
In this task you will learn details about binaries compiled from C code (with gcc) in a Linux environment, and how some basic things can be exploited such as process redirection or control flow hijacking. We strongly encourage students consult the intro video included in the resources section above to help orient you to the task more generally.
For this task you have an executable binary named flag which is vulnerable to a buffer overflow in one of its functions. We will be using a Python exploitation library called pwntools to automate some of the overflow techniques and get the binary to call a function it otherwise wouldn’t have. This function called call_me() generates a key using your Gradescope User ID to get a valid flag that you will ultimately write to your project_binexp.json file for grading.
Now we will run the binary just to see what the program is doing:
$ cd ~/project/01_basic_overflow_2
$ ./flag
We see the binary is asking for a string. Input any text you want or just press enter and you’ll (likely) see that the program does nothing and just exits. That would align with our expectations from reading the source code (flag.c). If we look into the function, we can learn…
read() attempts to read up to count bytes from file descriptor fd into the buffer starting at *buf
Oh no! In this case, read() will write up to 1000 bytes into the buffer, but buffer is only sized for a lesser amount. As we learned earlier, a buffer overflow occurs when too much data is fed into an unprotected (or poorly protected) data buffer; it would appear that flag is vulnerable to a buffer overflow.
DEVELOPING THE EXPLOIT
Open e.py with your preferred text editor (the VM comes with xed by default) and analyze the content and comments. Once you understand what they do, proceed to uncomment the code in Part 1 and fill out the cyclic() size. What size do you need to make payload in order to trigger the segmentation fault from the buffer overflow?
After this, run the exploit through GDB:
python3 /home/binexp/project/01_basic_overflow_2/e.py dbg
This will open up a GDB terminal with a breakpoint set at main(). Within that terminal, pass the “continue” or “c” command to resume the process execution.
Note: the above screenshot is intended to be demonstrative; your actual values may not match what’s shown. If you’re not seeing the ret instruction overflowed with cyclic() data, you may need to increase the size of your input (perhaps considerably so!).
We see the program received an interrupt signal for a SEGMENTATION FAULT (SIGSEV, or an invalid access to memory). This happens when the program tries to access memory at a certain location that it either isn’t allowed to access, or doesn’t exist. In this case the return address for the function was overwritten by cyclic()’s data in the form of a long string of character bytes. Pay attention to the bottom of the screenshot where the instruction pointer is currently trying to ‘ret’ (return) to 0x6561……616b which is just a string of in hexadecimal form.
Now that we know how to break the binary, let’s figure out how to be a little more deliberate/purposeful. Using a pwntools method called cyclic_find() we enter in the bottom 32 bits (4 bytes) of the return string (in the screenshot, the example is 0x6561616b) which will give the number of characters before reaching that value. By knowing exactly how much input we need to overflow our target, we can – in theory – overwrite the target with an arbitrary alternative, thereby hijacking the control flow.
Need more insight into the above? Try checking our FAQ for more details on
cyclic()andcyclic_find().
Returning back to e.py, go to “Part 2” in the code comments and update the value for offset based on what you’re seeing from above. Our goal at this step is to validate that we do – in fact – have total control over our target in memory. You might be tempted to skip this step, but you run the risk of simply assuming you’re correct when you’re not; many students have lost hours/days of project time troubleshooting exploits in other exercises because there is something amiss with their offset.
After you have done that, rerun e.py with the dbg option – ensuring to (c)ontinue again when the pwndbg terminal opens again.
If done correctly, you should see something like this screenshot. If you check the ret instruction, we are now failing on an invalid access to our dummy address.
Stepping away from the pwntools library for a moment, we now need to find something usable within the binary that will allow us to actually call a function or do something other than just crashing the program.
Now we will use a linux command objdump which takes a binary file and will output a dump of the binary’s assembly. The -D flag will output binary addresses, machine code, and assembly code of the binary into a file.
objdump -D flag > flag.asm
Then open flag.asm.
You will see a bunch of (likely) confusing information that – at a high level – translates to the code that you can see in the flag.c file. You aren’t going to have to go through this file at length (unless you want to); we are just going to focus on finding an address within the binary file that holds the machine code responsible for reading from /proc/flag. Search flag.asm for call_me in order to find corresponding assembly instructions.
The last part of this exercise is figuring out which assembly instruction is most apt to jump to. Leverage what you learned in the previous Stage, the linked materials in the “Resources” section, and try to determine where it would be best to ret to! When you’re ready, update “Part 3” in the e.py file and run your exploit:
python3 e.py
Common Pitfalls
Step C.3: Exercise 2
01_deja_vu [5 pts]
Version: 51314d324d444d3149464e316257316c636941794d444932494735316247773d
Resources
- See our
- https://www.cs.uaf.edu/2017/fall/cs301/lecture/09_11_registers.html
Challenge Instructions
In this exercise, you have a flag binary which will fetch a sha256 hash of /proc/flag by default.
- First, you should evaluate the binary and determine where/how it’s vulnerable.
- Next, see if you can identify what your target(s) should be. Note: unlike other exercise(s) you may have done, there may be more than 1 value you’ll find interesting, but bear in mind you can only provide input once.
- Next, try performing a basic overflow of the program and see what values you can overwrite in
GDB. You can view the hex values of a given variable in GDB with the command likex cmd(or print out their string representations asp/s cmd), if it helps. - The tricky part for this task is in keeping track of multiple offsets relative to one another.
Common Pitfalls
Step C.4: Exercise 3
02_the_server_client_one [10 pts]
Resources
- See our
Challenge Instructions
Now it’s time for our first unguided challenge for the section.
This challenge is designed around communication between a server and a client. The client binary (flag) will send data to the server (aux). The server then appends some very conveniently structured data to that message and sends it back to the client. Your goal for this task is to have aux return the ideal data to overwrite the instruction pointer within the data that is returned to flag.
Follow the same steps in your earlier buffer overflow task(s) to break the program in GDB, then figure out your buffer size and try to fill in the response to correctly hit this function call.
Note: the templated e.py file will start the aux binary on your behalf when prototyping your exploit. If you elect to manually manage calls between flag and aux instead, you must restart the server each time you run the binary.
Common Pitfalls
Overview
It’s been a few years since “” was originally published; since that time additional binary protections have been enacted to mitigate the dreaded buffer overflow. This includes things like:
- Address Space Layout Randomization (ASLR), which randomly arranges the address space positions of key data areas of a process.
- The No eXecute (NX) bit (otherwise known as Data Execution Prevention – DEP), which marks certain areas of the program as not executable (including the stack).
- …and much, much more.
But this hasn’t stopped buffer overflows from being problematic. Return-Oriented Programming (ROP) is a technique that was developed to otherwise bypass these and other controls. At its heart, ROP makes use of snippets of code that already exists within the binary – so called “gadgets” – in order to manipulate the code flow.
Learning Objectives
The core learning objectives for this section are:
- Understanding function calls within 32- and 64-bit systems
- Working with ropper and understanding gadgets
Exercises
This section features 2 exercises:
03_inspector_gadget03_ROPscotch
Step D.1:
So what are ROP gadgets?
At its heart, the “return” in “return oriented programming” is what defines every gadget out there. If you were to dump the assembly instructions from these binaries (e.g. using objdump), you would find any number of instruction sequences that terminate with a ret instruction. By jumping into these instructions, we allow for some atomic, register-oriented actions to take place before the ret instruction hits, thereby returning the execution flow back to the stack (which we ideally control, given our stack-based overflow techniques).
As an exercise, try dumping the assembly from our first problem in Stage 00 and CTRL+F search through the resulting flag.asm file for instances of the ret instruction:
objdump -D ~/binexp/01_basic_overflow_1/flag > flag.asm
Now – obviously – manually parsing through an objdump for a list of operations preceding ret is quite tedious; this is compounded by the fact that not all instruction sequences are necessarily useful to us. Fortunately, we have a tool available for us to quickly identify all number of gadgets on our behalf: ropper!
As a follow up, try using ropper on the same binary:
ropper --file ~/binexp/01_basic_overflow_1/flag
Do the addresses match?
In essence, we’re still performing jumps to areas in code – much like how we were in the stack smashing portion; only this time, we’re additionally leveraging these gadgets to do some setup and register manipulation in order to allow us to get some other malicious actions done.
So how are function calls made?
Thus far, you’ve seen at least one example for how functions are called through assembly instructions and registers: recall the call instruction, which we’ve looked to several times in the past several exercises.
Up until now however, you’ve probably not thought about the structure/setup that these function calls have had to observe. What happens – for example – when a function has an argument (or two+)? Here is one difference between 32- and 64-bit architectures that’s worth noting. In 32-bit architectures, these arguments are pulled from the stack; by contrast, in 64-bit architectures, these values are referenced from the registers.

So, for example, when foo(bar,baz) is invoked in a 32-bit system, we’d want a payload looking something like:
payload = cyclic(...)
payload += p32(foo)
payload += p32(pop_pop_ret_gadget)
payload += p32(bar)
payload += p32(baz)
In the above example, first the function call to foo() is crossed in the stack. When that function call is made, the very next value in the stack is considered the return address; in this case, we’ve overflowed it as being an arbitrary pop_pop_ret gadget (I say “arbitrary”, because it largely doesn’t matter which registers – save for reserved ones like EIP, ESP, and EBP – will hold the removed values in 32-bit systems). The next values in the stack fit the sequential order of arguments expected (first bar, then baz). In this case, we’ve used the particular gadget because of how it will remove bar and baz from the stack after execution by “popping” them; this sets us up for sequential function calls as needed (aka ROP chaining).
There’s a subtle difference when it comes to 64-bit systems like the VM the project is hosted on. In those kinds of systems, you want to lead with the ROP gadget first. This is because it’s necessary to stage the arguments for the function before it’s called. Moreover, we need to be quite selective about which ROP gadgets we reach for (vs. the more arbitrary choices in 32-bit systems); this is because functions will look to specific registers for their values (starting with RDI for the first argument). More generally, you’d want your payload looking like this:
Assuming that the initial address you overwrite in your buffer overflow is a “pop” gadget, the code flow will…
- (ret)urn to the pop gadget, popping the arguments off the stack and into the respective registers.
- At the end of the gadget, it will (ret)urn again – this time to the address of the function in question.
- When the function ends, it will (ret)urn back to whatever’s next in the stack; if we’re chaining ROP calls, this would mean going back to step (1).
Step D.2: Exercise 1
03_inspector_gadget [15 pts]
Version: 51314d324d444d3149464e316257316c636941794d444932494735316247773d
Resources
- See our
- https://www.uclibc.org/docs/psABI-x86_64.pdf (see figure 3.4: register usage)
- https://cwe.mitre.org/data/definitions/367
- https://cs.brown.edu/courses/cs033/docs/guides/x64_cheatsheet.pdf
- https://www.geeksforgeeks.org/python/python-write-bytes-to-file/
Challenge Instructions
In this task, we’re going to build on our understanding of ROP by having you dig into more complicated gadget chains. Additionally, we’ll also need to work with yet another kind of vulnerability: race conditions! As always, evaluate the source code and try to come up with a plan of approach before you start exploiting.
On ROP
In past examples, we’ve shown how function calls in 64-bit systems have relied on arguments being placed in their appropriate registers. This is trivial when we have gadgets on-hand that simply pop the value off of the stack and into the register. However, we’re not always so fortunate as to have such options available. Instead, there’s usually a multitude of more complex gadgets present that we need to string together in a chain in order to setup our function calls. For example, instead of…
pop rdi; ret;
We might need to utilize 2 or more gadgets to achieve the same effect like…
pop rbp; ret;
mov rdi, rbp; ret;
In the above example, the first gadget pops the stack value not into RDI, but into RBP. We then use the 2nd gadget to move that popped value from RBP and into RDI.
For this exercise, we’ve provided a slew of such semi-useful gadgets in the gadgets() method of the flag.c source code. While you can solve the task using these exclusively, you’re more than welcome to identify other working gadgets using ropper on the binary as well.
RACE CONDITIONS
A race condition is a kind of concurrency problem when two or more threads/processes attempt to access shared data simultaneously. Because the execution order is unpredictable, this can lead to unexpected behavior, data corruption, or even program crashes. Because race condition vulnerabilities are unpredictable, exploiting them sometimes can require multiple iterations/attempts before catching the desired aberrant behavior.
TOCTOU
A Time-of-Check, Time-of-Use (TOCTOU) race condition occurs when there is a split between when a resource is initially accessed and when that same resource is actually utilized. If these operations are not atomically secured/linked, then a vulnerability arises where that resource can change between when it’s checked/used.
This particular exercise makes use of a kind of TOCTOU in practice, but you’ll need to identify how to construct your exploit appropriately around it. As always, make sure user.txt is set properly before reading from /proc/flag or else Gradescope will reject your hash!
Common Pitfalls
Step D.3: Exercise 2
03_ROPscotch [15 pts]
Version: 51314d324d444d3149464e316257316c636941794d444932494735316247773d
Resources
- See our
- Did you know ?
Challenge Instructions
In this task, we’re going to layer our working understanding of stack-based overflows in performing some ROP. Additionally, we’ll grapple with yet another vulnerability: Integer overflows! Look over the guidance below and then extend it to the source code in figuring out how to exploit flag and get your hash!
INTEGER OVERFLOWS
While numbers more abstractly can extend to values +/- infinity, classical computers cannot hold such unbound values (or rather, various representations of said numbers are capped). Let’s take a contrived example of an unsigned nibble (4-bits). In this case:
0000
Would be the smallest value that could be represented (0 decimal) and…
1111
Would be the largest value that could be represented (15 decimal).
In the above case, incrementing the max value (15) by 1 would cause the stored amount to overflow, looping the value back around to 0. Inversely, decrementing the minimum value (0) by 1 would cause the stored amount to underflow, looping the value back around to 15.
How would the above example change if we used a signed representation – where the most-significant bit controlled whether the value was positive/negative?
Failures to account for these kinds of issues (i.e. having to handle larger/smaller values than anticipated) can have , sometimes even fatal ones.
TYPE PROMOTION/DEMOTION
There are other ways for integer overflow/underflows to occur than just incrementing/decrementing values. One such method is via type promotion/demotion. This can occur when a value of one type (e.g. char, size 1 byte) is cast to another data type (e.g. short, size 2 bytes).
When a smaller datatype is promoted, the new bits are maximally extended (i.e. 0000 becomes 11110000). Conversely, when a larger datatype is demoted, the most significant bits are truncated (i.e. 11110000 becomes 0000).
If not properly accounted for, this can have unintended consequences. For example, if we demote a signed char value of decimal 121 (01111001) to a nibble (1001), we end up with -7 if signed or 9 if unsigned.
On ROP
- Once you’re able to perform the actual buffer overflow, you should find the necessary ROP gadget(s) you need to make your function call.
- But which function should you call?
almost()?system()? Something else altogether?
- But which function should you call?
- Another troubling problem is that there doesn’t appear to be a call being made to read
/proc/flaganywhere. Fortunately – just like with the ROP gadgets – all of the pieces of code/data you need already exist within the binary, you just need to piece the function call(s) together with argument(s) that already exist!
Common Pitfalls
Step E.1
Welcome to the final section of the Binary Exploitation project! We reserve this section semester-over-semester for more advanced topics as well as binaries that we feel help extend student comprehension over the prior sections. Topically, the exercises do not necessarily relate to one-another and thematically should be approached as being distinct in their learning objectives.
Exercises
This section features 3 exercises:
03_shakespeare02_world_of_shellcraft03_ouroboros
Step E.2: Exercise 1
03_shakespeare [15 pts]
Version: 51314d324d444d3149464e316257316c636941794d444932494735316247773d
Resources
- The
- This
Guidance
In this challenge, we’re going to introduce and work with a particular kind of ROP gadget schema: the write-what-where (WWW) gadget!
In our associated tutorial video, we show how we might pop a value into a given register so that it might be passed as an argument to an associated function call. For a single argument, this can reductively be shown as:
payload = p64(pop_rdi_gadget_addr)
payload += p64(0x12345678)		# The argument passed (in this case to RDI)
payload += p64(function_addr)
The above works so long as whatever function we’re calling at function_addr is expecting an integer value not unlike 0x12345678. But what about a function like system()? If we reference our very first exercise (01_basic_overflow_1) back in Stage A, we can use GDB to see how our call to system() is setup:

Notice how system() does not process the string cat /proc/flag directly, but instead receives a pointer to the string (in this case, at address 0x599ef4d57051).
Again, this isn’t so much a problem so long as…
- …the string
cat /proc/flagalready exists in the binary AND… - …we know the address where that string exists at runtime.
So long as the above is true, we would only need to make minor modifications to our payload:
payload = p64(pop_rdi_gadget_addr)
payload += p64(0x599ef4d57051)		# The pointer to “cat /proc/flag”
payload += p64(call_system)
But what if neither of these conditions were true? Here’s where the WWW ROP technique comes in handy!
WRITE-WHAT-WHERE
In principle, the WWW method makes use of existing functions/gadgets within the target binary in order to allow us to arbitrarily write a payload into memory; in practice, this might be passing malicious strings like /bin/sh in order to attain a shell or overwriting other values not otherwise directly accessible by the buffer overflow. This – as you might imagine – is a very powerful exploit primitive.
One common WWW gadget is the mov <[register1]>, <register2> gadget. Note how the square brackets around register1 indicate that the address is getting dereferenced. This gadget writes the contents stored within register2 to the area of memory pointed at in register1.
Assuming we have control of both registers (usually though not always through the use of other gadgets), we can perform the arbitrary write through the following steps:
- Set
register1to an address pointing to a writable area of memory - Set
register2to be the data you want to write - Invoke the WWW gadget
But where are we meant to write to?
Theoretically, anywhere that’s writable, including your buffer that you’ve overflowed. Practically speaking however, it’s more appropriate to say anywhere that’s writable that we know the address of. Because our variable addresses are assigned to the stack, predicting those addresses is near impossible without a kind of memory leak. So where else then?
Well, assuming our binary isn’t compiled with PIE, then our binary has several fixed virtual address spaces available for us to use. Try running readelf -S flag to see them (areas flagged with a “W” are considered writable). Typically the .data and .bss sections are safe to write in without introducing too much instability (being reserved for initialized and uninitialized global variables). You can also see the address spaces within GDB by running the info files command (though it won’t tell you if they are writable or not).
Challenge Instructions
- This binary plays with the : that while most keystrokes produced by a monkey at a typewriter are nonsense, given infinite time they would be able to produce the complete works of William Shakespeare. In the spirit of that theme, this flag binary ingests (seemingly) nonsensical input looking for signs of Shakespeare’s work!
- Assuming you can satisfy the binary’s logic, you then have to perform a standard buffer overflow. Review the flag.c source code and figure out where the vulnerability is and how you can exploit it.
- Once exploited, you’ll note that there is no
system("cat /proc/flag")call made anywhere. In fact, the stringcat /proc/flagisn’t resident on the binary at all! Fortunately, thegadgets()deadcode has a usable set of gadgets available to us. You’ll need to leverage them (and any other code laying about) in order to write your own arguments.
Step E.3: Exercise 2
02_world_of_shellcraft [10 pts]
Version: 51314d324d444d3149464e316257316c636941794d444932494735316247773d
Resources
Guidance
Thus far we’ve largely constrained our binary exploitation efforts to hijacking the control flow of running processes in order to make them do something they were already natively programmed to accomplish; much of our exploits simply involved having the binary utilize/execute pre-existing or pre-programmed (though often dead) code.
In this challenge, we’re going to build upon our understanding of exploitation by introducing a new concept: shellcode injection.
WHAT IS SHELLCODE?
At this point, you’ve come to understand how our original C-based programs could be broken down into more granular operations performed via x86_64 assembly instructions. Our exploit efforts have largely revolved around both identifying vulnerable code at a high level and – in some cases – leveraging more specific assembly operations at a lower level.
It should come as no surprise that the Assembly language itself is – in fact – an abstraction of the bytes that compose the binary. In fact, you’ve already seen this connection in your objdump output (and potentially even in GDB, if you were so inclined):

Shellcode injection makes use of this fact by writing raw bytes into a running process’ memory directly for execution. Put plainly, you’re writing new code for the program to execute on-the-fly while it’s running!
WHY DO WE CARE?
Some of you – rightfully – may be asking “so what”? We’ve merely gotten the binaries to do something that’s already programmed into them (albeit perhaps not in the program’s normative execution flow, such as residing in dead code). In most cases, that’s usually a system() call to read from /proc/flag.
Shellcode changes the game entirely because you’re essentially having a running process do anything you’d like it to – you could even have the program spawn a shell under the process’ EUID. Imagine finding such a vulnerability within a process running as root!
Challenge Instructions
In this challenge, we are looking to perform a basic buffer overflow which redirects the code flow into executing shellcode you write into memory. The steps to do this at a high-level will look as such:
- Perform a basic buffer overflow and hijack control of the
retinstruction. - Overflow the
retaddress with the address of the buffer. - Generate your proof-of-concept shellcode
- Modify your payload such that it includes your shellcode. This will look something like:
[SHELLCODE] + [PADDING TO OVERFLOW RET] + [BUFFER ADDR]
What we’re looking to achieve here is to redirect the control flow back into an area of memory we control: our buffer! Once there, it will parse whatever shellcode we’ve written into the stack and execute it.
Some advice:
- Obviously, you need to be very precise with the bytes you pass into
shellcode. Most of you probably don’t know off the top of your head what combination of bytes equate to which assembly instructions (and writing an exhaustive dictionary would explode the size of this doc). Fortunately, there are several references you can look at:- First, you can cross-reference existing binaries (either in other challenges or your own compiled toy code) and
objdumpthem to see the bytes that align to various instructions. Don’t know the bytes forsystem("cat /proc/flag")? Just compile it with gcc and dump it to see for yourself how it could be done. - After doing the above, you can confirm that your bytes are properly written/strung together using shell-storm.org’s handy (making sure it’s set to x86(64) for its output). This will output your bytes as assembly instructions which can help affirm you’re on the right track.
- Another option you could consider reaching for to help get you started are examining some of the available on shell-storm.org (Specifically those under “Linux -> Intel x86-64”).
- Finally, did you know that pwntools actually comes with its own shellcode generator (called “”)? You might find it useful for helping rapidly prototype your own shellcode payloads.
- Just to make it explicitly clear: you need shellcode that will directly read out from /proc/flag (vs. indirectly attaining a shell as the binuser and trying to read it with cat).
- First, you can cross-reference existing binaries (either in other challenges or your own compiled toy code) and
- One of the headaches shellcoders encounter is the concept of “bad bytes”. Different programs and methods may have particular behaviours reserved for particular bytes. For example, cuts-off input from
stdinwhen encountering anewline– in Linux, that would be byte0x0a. In this example, if our shellcode payload had the byte (0x0a) in it,gets()would cut off our payload at that byte (and fail to read in anything after that).- This isn’t a dead end, however! There’s various ways we can achieve similar outcomes in case one assembly operation contains a bad byte. Consider how all of these achieve the same desired effect:
xor eax, eax;mov eax,0; andpush 0; pop eax. Just because one operation fails doesn’t mean we can’t achieve our desired endstate by using a different series of operations which don’t use the bad byte. - The most sure-fire way to handle this – of course – is by crafting shellcode manually (vs. relying on automated shellcode generators or pre-built shellcode). However, there are a variety of encoders out there – such as the shikata ga nai encoder in msfvenom – that can help you retool shellcode to avoid bad bytes (note: neither shikata ga nai nor msfvenom as installed on the issued VM). Shellcraft can also do this natively, but you’ll need to consult the documentation to figure out how.
- This isn’t a dead end, however! There’s various ways we can achieve similar outcomes in case one assembly operation contains a bad byte. Consider how all of these achieve the same desired effect:
- Not sure if your shellcode’s wrong? Try compiling/running it. See example:
- gcc shellcode.c -o shellcode -z execstack -fno-stack-protector -no-pie
shellcode.c
#include <stdio.h>
#include <string.h>

int main()
{
    // https://shell-storm.org/shellcode/files/shellcode-878.html
    // reads out /etc/passwd
    char code[] = "\xeb\x3f\x5f\x80\x77\x0b\x41\x48\x31\xc0\x04\x02\x48\x31\xf6\x0f\x05\x66\x81\xec\xff\x0f\x48\x8d\x34\x24\x48\x89\xc7\x48\x31\xd2\x66\xba\xff\x0f\x48\x31\xc0\x0f\x05\x48\x31\xff\x40\x80\xc7\x01\x48\x89\xc2\x48\x31\xc0\x04\x01\x0f\x05\x48\x31\xc0\x04\x3c\x0f\x05\xe8\xbc\xff\xff\xff\x2f\x65\x74\x63\x2f\x70\x61\x73\x73\x77\x64\x41";
    (*(void(*)()) code)();
    return 0;
}
Step E.4: Exercise 3
03_ouroboros [15 pts]
Version: 51314d324d444d3149464e316257316c636941794d444932494735316247773d
Resources
- TBD
Guidance
In this exercise, we’re going to be building on our ROP comprehension by introducing a new technique: stack pivoting! In brief, stack pivoting is a means for hijacking the process’ stack pointer (RSP), thereby changing what the process is viewing as the current stack. Why is this useful?
In other ROP exercises, you generally have to perform a standard buffer overflow in order to hijack the control flow of the process; once you had, ROP would have you chain together a circumstantially-dependent number of ROP gadgets, ultimately leading to invoking some function(s) that would lead to the flag. That’s all well-and-good, but what if your overflow is constrained (i.e. you don’t have enough space in memory to write out a complete ROP chain)?

This is where stack pivoting is handy. Since we cannot continue to load-up the stack with our gadget chain after the ret address (like we usually might), we need to find somewhere else to write our ROP chain and then relocate RSP to point to it. Where you write the gadget chain to depends on the binary, though it’s typically one of the following:
- The .bss or .data segments of the binary (if writing to an (un)initialized variable in memory).
- The heap
- Elsewhere within the stack
Now how do we do this? Well – since this is a ROP exercise – let’s consider some gadgets!
EXAMPLE STACK PIVOT GADGETS
pop rsp
This one should come as no surprise to you; if we can pop an address off of overflowed memory, then we can write the location of our gadget chain directly to RSP.
pop <reg>; ret;
xchg <reg>, rsp; ...; ret;
This is a pair of gadgets; the first one is substitutable with any gadget(s) that ultimately grant you control of a register targeted by the xchg operation. , the xchg operation swaps the values of contents stored between its operands. In effect: you write your gadget location to one register (specified by whatever \<reg\> is), then swap it into RSP.
leave; ret;
This one can be deceptively tricky to understand, but a really common gadget present in compiled binaries. This gadget is typically found at the end of every function (besides main()), in order to preserve the callstack between functions. The leave operation sets RSP to be whatever RBP is. Next, it pops the top of the stack into RBP. Finally, the ret operation pops the return address from the stack and jumps there.
In this case, our goal is to be able to overflow RBP (which is not atypical for a buffer overflow and also stored in the stack):

RBP gets moved into RSP, and then the rest is history!
Challenge Instructions
To complete this challenge, you’ll need to keep the following in mind:
- First, read the source code and understand how the binary is vulnerable.
- Perform a buffer overflow and hijack the process’ control flow during runtime.
- Identify an appropriate location to write your gadget to, then find and leverage a stack pivot gadget to relocate the stack.
- Finally, assemble a simple ROP gadget chain to attain your flag.
Submission Details
- Submission Details
- FAQ
- Q1) What does a flag look like?
- Q2) Do I need to submit to both Gradescope and Canvas?
- Q3) How many attempts can we submit to Gradescope?
- Q4) Once I submit to Gradescope, when will I get my grade?
- Q5) Do I get partial credit for passing some tasks?
- Q6) How late can I submit to Gradescope?
- Q7) Can I get an extension on my project deadline?
- Q8) Gradescope isn’t recognizing my flag as valid; what do I do?
- Q9) Gradescope timed-out processing my submission; what do I do?
- FAQ
Your grade for this project will be handled through Gradescope. You will submit just one file: project_binexp.json, which you should receive as an unfilled template on your VM. If you did not – or cannot otherwise locate it – below is the template that you can copy:
{
  "01_basic_overflow_1": "INSERT FLAG",
  "01_bb_steps": "INSERT FLAG",
  "01_assemble_the_assembly": "INSERT FLAG",
  "01_basic_overflow_2": "INSERT FLAG",
  "01_deja_vu": "INSERT FLAG",
  "02_the_server_client_one": "INSERT FLAG",
  "03_inspector_gadget": "INSERT FLAG",
  "03_ROPscotch": "INSERT FLAG",
  "03_shakespeare": "INSERT FLAG",
  "02_world_of_shellcraft": "INSERT FLAG",
  "03_ouroborous": "INSERT FLAG",
  "ec_01_codeblox": "INSERT FLAG",
  "ec_02_dialtone": "INSERT FLAG",
  "ec_02_stumble": "INSERT FLAG",
  "ec_03_madness": "INSERT FLAG"
}
NOTE: To ensure that the autograder accurately grades your submission, you should create your .json file in a text editor on the VM and submit from the VM. Do not use a word document program like LibreOffice or Word. The submission must be proper json format for the autograder to give credit.
FAQ
Q1) What does a flag look like?
Flags are produced in reading out from /proc/flag on the VM. They are a long sequence of hex characters. An example of a flag is shown in the screenshot below:

In the above example, you would copy the portion between the “Start FLAG” and “End FLAG” delimiters to the appropriate <copy flag here> spot in your project_binexp.json file.
Q2) Do I need to submit to both Gradescope and Canvas?
No. For this project, you will only submit your work to Gradescope.
Q3) How many attempts can we submit to Gradescope?
There is no limit to the number of times you can submit to Gradescope. By default, Gradescope retains your latest submission (not your highest scoring one); you can manually change which submission attempt should be considered for your final grade within the Gradescope submission interface. We will not be changing this for you.
Q4) Once I submit to Gradescope, when will I get my grade?
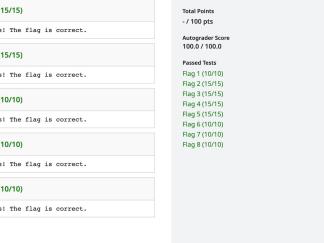
Grades will be released after the due date + any extensions have expired. However, Gradescope will give immediate feedback to you on whether or not your flag(s) pass our autograder checks. There are no hidden tests, so you can be confident that your score in gradescope will reflect your final grade for the project (barring extra credit – if offered – and/or any issues with academic integrity).
Q5) Do I get partial credit for passing some tasks?
You get credit for each correct flag successfully submitted to Gradescope. If you do not get a correct flag, you are not awarded points for that portion of the project.
Q6) How late can I submit to Gradescope?
This project has a firm deadline with no late submission policy; please consult the syllabus schedule. Once opened, Gradescope will show when the deadline is along with how much remaining time you have.
Because there are no limits on the number of submission attempts you have, we encourage you to submit early and often. Waiting until the project deadline introduces risks (i.e. Gradescope being flooded by hundreds of student submissions at the same time, Gradescope timing out, etc.); generally speaking, we do not extend the project deadline for such service outages.
Q7) Can I get an extension on my project deadline?
In most cases, no. This includes things like vacations, busy work weeks, general fatigue, etc.
Project extensions will be considered on a case-by-case basis for instances like natural disasters, military deployments/mobilizations, and medical hospitalizations. However, we will require documentation as appropriate (e.g. doctor’s note, military orders, etc.).
ODS accommodation letters do not automatically grant you extensions; such instances are determined on a case-by-case basis as to how best implement the accommodation – not all assignments are subject to extension. If you have such an accommodation letter, please reach out to the TA team as early as possible so we can be made aware.
As much as can be helped, please notify the TA team as early as possible of your request for an extension.
Q8) Gradescope isn’t recognizing my flag as valid; what do I do?
There’s a variety of things that could be contributing to this. Here’s some troubleshooting steps:
- Double-check that
/home/binexp/user.txtis set to your GTID; do not add other characters, such as single- or double-quotes. - Make sure you’ve copy/pasted the flag in its entirety; occassionally we encounter user error where students miss 1 or 2 characters.
- Your choice of text editor may have introduced invalid characters into the project_binexp.json file. This is common with software like LibreOffice and MS Word Document editor. We recommend editing the file either from the command line with vim or through the VM’s TextEdit utility (xed).
- Your JSON formatting may be incorrect; ensure that all of your flag hashes are in-line, book-ended on both sides with quotes, and – with the exception of the last entry – terminated with a comma.
- Make sure you’ve copied the flags to the correct position within the project_binexp.json file; occasionally we see students accidentally swapping the position of key:value pairs.
- Make sure that the flag is being produced by the original binary fetched by the
binexp.shsetup script. Occasionally we see students try to recompile their own version of the flag binary and/or patch the original binaries with different assembly instructions; these different versions of the binaries fail to match the fingerprints of the project binaries we have on file. - One or more of your JSON keys are incorrect; this happens most often when students choose not to use the provided template and make a spelling mistake (or mislabel a key as “01” vs. “02” or “03”, for example).
- Submitting flags generated through GDB won’t work; see the related FAQ on the subject via the FAQ menu.
- Ensure that the correct binary is yielding the flag; occasionally we see students mixing up which e.py exploit corresponds to which
flagbinary, producing a flag made by a different binary.
If all of the above fails, reach out to the TA team for assistance on the appropriate megathread.
Q9) Gradescope timed-out processing my submission; what do I do?
For this particular project, this usually happens due to a high volume of traffic to Gradescope. Wait a few minutes and try again.