



Learning Goals
Students will learn introductory level concepts about binary exploitation. This project is designed to develop your understanding of control flow hijacking through different tasks/challenges showcasing select vulnerabilities or weaknesses in compiled binaries. By the project’s end, you should…
- …be familiar with simple C syntax and assembly operations.
- …able to identify common memory-based vulnerabilities.
- …capable of crafting basic exploits from scratch
Tools you will use
- Python – While you are welcome to craft your exploits using other tools/frameworks, in this project we teach to using Python and the
pwntoolslibrary for automating/scripting our exploits. - GDB – The GNU Debugger is a useful tool for understanding the underlying behavior of a program during runtime. We have extended its native capabilities with the
pwndbgplugin for additional output and readability. - objdump – The
objdumptool will allow us to disassemble the compiled binaries, affording us an opportunity to perform static analysis of the binary’s instructions at a more granular level than what the C source code alone can. - ropper – A useful tool for identifying so-called “gadgets” to facilitate return-oriented programming (ROP). Additional information concerning what ROP and gadgets are will be covered in the appropriate sections of the project.
Recommended Reading
To deepen your understanding of binary exploitation, consider reviewing:
- The
~/project/tutorial/README.mdand the associated follow-along code. - The project tutorial videos:
- explaining some rudimentary basics of Computer Architecture
- on how the Stack and Function Calls work in C
The final deliverables:
A single JSON-formatted file will be submitted to Gradescope. This file should be named project_binexp.json. A template can be found on the Submission Details page.
Project Environment
This project runs in an OVA-formatted Virtual Machine (VM) with all the binaries/tools required, and must be used to generate the correct flags. We recommend running the VM through Oracle’s . Login credentials for the VM to access the project’s materials can be found through Canvas.
TABLE OF CONTENTS
Frequently Asked Question(s) (FAQ)
- Frequently Asked Question(s) (FAQ)
- Submission and GradeScope
- Virtual Machine Questions
- Q1) Do I need to use the provided VM for this project?
- Q2) I am retaking this course. Can I use the VM that I downloaded from an earlier semester?
- Q3) Can I SSH into the VM and perform the project?
- Q4) Should I update the VM?
- Q5) Can I recompile the binaries?
- Q6) May I move/relocate the files from their default location?
- Flag Task Questions
- Q1) How do I know if I got the flag for a given binary?
- Q2) I got to the flag in GDB but I don’t see a message output with the flag; where is it?
- Q3) I’m given a different flag everytime I run my exploit; is something wrong?
- Q4) What is “/proc/flag”?
- Q5) How does cyclic() and cyclic_find() work?
- Q6) I’m making the call to read from /proc/flag but my exploit keeps seg-faulting; what’s wrong?
- Q7) My e.py file is throwing a “can only concatenate str (not bytes) to str” error; what gives?
- Q8) When I’m stepping through instructions in GDB, I enter “n” and it skips over my desired target function call; help!
- Q9) Why are the tasks prefixed with letters like 01, 02, 03_, etc.?
- Q10) I want to run VSCode in the VM, can I?
Make sure you have read:
- explaining some rudimentary basics of Computer Architecture
- Please refer to: Required Reading > VM Troubleshooting, for VM related troubleshooting questions.
Make sure you have watched:
- I’m Developing on how the Stack and Function Calls work in C
- This
Submission and GradeScope
Please navigate to the Submission Details menu page, left.
Virtual Machine Questions
Q1) Do I need to use the provided VM for this project?
Yes. You won’t be able to complete the project without using it, as the environment is set up specifically to handle this project.
Q2) I am retaking this course. Can I use the VM that I downloaded from an earlier semester?
No. The VM is updated semester-over-semester; flags submitted to Gradescope from a VM released in a prior semester will be rejected. Please use the current semester’s VM.
Q3) Can I SSH into the VM and perform the project?
When you run your e.py exploits with GDB, a separate terminal is opened with the process hooked to GDB. Some students have reported handling this by using tmux. Once you SSH into the VM, kill existing tmux sessions:
tmux kill-session
And then start a new tmux session with:
tmux -CC
This will open up a new window with 2 separate scrollable sections for pwndbg and e.py.
Q4) Should I update the VM?
Do not update the machine.
You can allocate more resources via the Virtual Box (or other platform) configurations depending on your local host but you shouldn’t need to.
Q5) Can I recompile the binaries?
If it helps your comprehension, you’re welcome to recompile the source code with whatever alterations you want; in fact, we suggest doing this in some of the binaries in section 04, for example.
However, we have fingerprinted the binaries that are shipped out to you all with the project; your final exploit(s) will need to utilize them as is. Gradescope will recognize if you attempt to submit a flag from a binary that wasn’t among the original set.
Q6) May I move/relocate the files from their default location?
We strongly discourage this. The binaries rely on files residing in particular locations, such as /home/user.txt, among others. However, you ARE welcome to make copies/backups as needed if it helps facilitate your testing.
Flag Task Questions
Q1) How do I know if I got the flag for a given binary?
All of the flags in the project are read-in by the binaries through /proc/flag. For an example of what that might look like, see:

Note how our flag generator denotes both your GTID (which is derived from /home/user.txt not /home/binex/user.txt as shown in the picture) and the exact binary that was used to produce the flag. You can cross-reference this information in case you encounter issues with Gradescope.
Q2) I got to the flag in GDB but I don’t see a message output with the flag; where is it?
We have configured our flag generation-mechanism (/proc/flag) to deny providing any flags to users who attempt to read from it via GDB. This is deliberate, because as a debugger GDB has a multitude of functionality that would undercut the learning objectives of the tasks. This includes – but isn’t limited to – using the set and call commands, for example. You will need to naturally arrive at reading from /proc/flag either directly from directly interacting with the binary along the command line or through a non-GDB optioned invocation of your e.py file (e.g. python3 e.py).
Q3) I’m given a different flag everytime I run my exploit; is something wrong?
No. This is expected behavior and nothing to worry about.
Q4) What is “/proc/flag”?
The /proc/flag file is the target for all of the binary exploits in this project. Every time a user reads from it, it outputs a uniquely encoded result (which we erroneously refer to as a “hash”) that contains reversible information fingerprinted to it that the autograder uses to evaluate for correctness.
You can test if /proc/flag is running trivially by reading from it like so:
cat /proc/flag
Note: while doing the above should yield a flag hash, it will not be accepted/validated by the autograder. Valid hashes will only be returned from exploiting the binaries.
Q5) How does cyclic() and cyclic_find() work?
We encourage you to read up on the tools you’re utilizing:
In brief:
cyclic() produces a bytestring of length “n”, where n is some integer value between 0 and the largest possible positive integer supported by the platform (e.g. sys.maxsize). Example usages might look like:
- cyclic(10)
- cyclic(25)
- cyclic(3000)
The output of cyclic() is a bytestring with a unique character sequence in chunks of 4 bytes at a time:

In the above screenshot, you can see the pattern as:
- aaaa
- baaa
- caaa
- etc.
This pattern is the same with every invocation of cyclic() and terminates at the nth character.
cyclic_find() reverse-engineers the above. It provides an integer corresponding to a particular segment in that aforementioned bytestring; you can supply it with a variety of inputs (e.g. a bytestring, a hex representation, etc.):

Note: You do not need to use all the cyclic() functions in e.py. In fact, you don’t need to use e.py at all for some of the flags. While pwntools’ cyclic() and cyclic_find() functions can make calculating the offset helpful for many of this project’s exercises, you may find it easier to not use them in some select instances.
Q6) I’m making the call to read from /proc/flag but my exploit keeps seg-faulting; what’s wrong?
In most cases of this happening, your exploit is catching on a movaps instruction somewhere within system.c like in the screenshot below:

If this is the case, the issue is related to . Because our exploits forcibly redirect the control flow in ways the process wasn’t expecting, there can be downstream consequences as the process executes along and refers back to our maliciously overwritten stack. By-and-large, you generally want to consider jumping to a different instruction within your targeted function.
Q7) My e.py file is throwing a “can only concatenate str (not bytes) to str” error; what gives?
The error is telling you that you’re mixing your data types in your payload within e.py:
## WRONG
payload = "A" * 100    #type str
payload += p64(0xwhatever)    #type bytes


## RIGHT
payload = b'A' * 100    #type bytes
payload += p64(0xwhatever)
Q8) When I’m stepping through instructions in GDB, I enter “n” and it skips over my desired target function call; help!
We speak to this in the 01 section, step 1.2: 01_bb_steps. Both the (n)ext and next instruction (ni) GDB commands step over function calls. To enter the function you need to (s)tep inside (or step inside, immediate instruction (si)).
Q9) Why are the tasks prefixed with letters like 01, 02, 03_, etc.?
We’ve labeled the tasks with numbers to reflect their relative perceived difficulty. You do not need to complete the tasks in any particular order. If you get stuck working on a problem, try working through some of the other challenges and come back.
As a clarifying note: Stages A through E are different from the numbered prefixes in front of the exercise names. The Stage letters are meant to help organize the various exercises by their corresponding subject matter. Each stage may have any number of 01_ thru 03_ exercises.
Q10) I want to run VSCode in the VM, can I?
Yes! We have an installer script located at /home/InstallVSCode.sh. The binexp user has sudo permissions to run this script.
Unfortunately in order to preserve the integrity of this and other projects, we will not be providing root access to the VM. Any other software you want to install on the VM is allowed using apt, provided you do not need those privileges.
TABLE OF CONTENTS
Projects Binary Exploitation Stage A – Setup/Validation — (1 flags)
Learning Objectives
Exercises
Step A.1
Step A.2
01_basic_overflow_1 [0 pts]
Instructions
OPTIONAL: Try using e.py!
Step A.3
Welcome to the Binary Exploitation (BinExp) project for CS6035! We’re excited to have you with us for this effort.
Binary exploitation is a really interesting and challenging domain within cybersecurity. It rests at the intersection of many sub-disciplines, including reverse engineering, low-level programming, operating systems, code review, etc. You’ll be expected to draw upon a variety of subjects matter in approaching and working through the challenges of this project. Understandably, many students find the project challenging at some point (or many points), due to the need to perform additional research in those areas on top of working the problems themselves; as such, we encourage you to not delay in getting started with the project!
Each stage within this project presents a set of learning objectives and associated challenges. We’ve endeavored to present these challenges in a logical order in the form of “Stages”, starting here in Stage 00 as a guided introduction to the project through to Stage 04 where you’ll be crafting your own novel exploits to some unique challenges. Within each stage, there are a number of exercises affiliated with the related material ranging from “easier” content (prefixed as 01, such as 01_basic_overflow_1) to more challenging tasks (difficulty 03). While we encourage students to proceed through the challenges in-order if you’ve never done anything like this before, you are welcome to approach this projects’ challenges in any order you’d like; in fact, if you’re stuck on an exercise it may be best to move along and return back later.
Learning Objectives
The learning objectives for this section are:
Project setup and understanding the project architecture
High-level introduction/exposure to project materials
Validation of project infrastructure, including:
Environment setup
/proc/flag
Gradescope
Exercises
This section features 1 exercise:
01_basic_overflow_1
Step A.1
Before diving in, let’s ensure that our project environment is appropriately configured.
This project utilizes the same virtual machine (VM) that is used for other projects within CS6035. If you’ve already got it configured, great! If not, see the respective “Course VM Download Thread” post in Ed Discussion for instructions.
Please follow the instructions in Canvas (navigate to “Assignments” > “Binary Exploitation”) for login credentials to the VM as well as the requisite commands for fetching the project files.
Navigate to /home/ open the user.txt file (this file will be empty initially) and enter your nine-digit GTID. If you do not know your GTID, you should be able to discover this through https://gtid.gatech.edu. Note: if you fail to set this, no responses you submit to Gradescope will be accepted as correct.
Below is a brief summary of the project’s contents:
project_binexp.json: This is the one (and only) file you will submit to Gradescope to have your work be evaluated. See the Submission tab along the left-hand side of this page for additional guidance concerning project submission guidelines.
project\*: This is the directory and subdirectories that make up the project. Each subdirectory reflects an individual challenge within the project and contains all of the files necessary for solving that particular challenge. We have included a project\tutorial\ subdirectory that has amplifying guidance material to help get you oriented to the projects’ techniques. The contents of project\tutorial\ are not mandatory or graded – you should not include any practice work results you perform there in your project_binexp.json file.
project\*\flag: For most of the challenges, this is the compiled binary you’re attempting to exploit. If it isn’t, the student instructions for that particular challenge will say so.
project\*\flag.c: This is the source code for the flag binary, above. This is intended to be a useful reference to aid in identifying and crafting your exploits of flag.
project\*\e.py: This is a python3 script with some templated skeleton exploit code. You are welcome to use/ignore this as you see fit.
project\*\e.py.bak: This is just a copy of the initial state of e.py in case you accidentally delete it or wish to revert back to start. Simply copy from this file to get a clean-slate e.py.
In all of the projects’ binaries, your goal is to have the binary read from /proc/flag! Most of the time, this is via a system() call like:
system(“cat /proc/flag”);
However, sometimes it’s not that simple – carefully analyze your source code within each challenge to figure out how the binary is meant to read from /proc/flag.
Step A.2
01_basic_overflow_1 [0 pts]
Instructions
Now, let’s take a look at our first introductory challenge to ease us into the exploit development process at a high-level: 01_basic_overflow_1. We’re going to walk you through this one just to give you a sense of what’s to come.
In this task, we’re looking at a simple buffer overflow. A buffer overflow occurs when input exceeds the expected bounds it’s intended to write to, thereby spilling outside those bounds and overwriting other areas of memory. Generally speaking, this kind of incident leads the running process to crash. However, a crafty (and determined) malicious actor may be able to get the process to do something else altogether!
If we were to review the source code for our binary (flag.c), we could start by tracing the code execution flow starting at main(), which is the starting point for all C program code.
cat ~/project/01_basic_overflow_1/flag.c
The main() function starts by initializing the variable make_me_not_zero to 0.
It then declares an int buffer of size 300.
There’s a printf() call, which would write some instructions to the user to stdout.
The process then blocks for user input with scanf(), writing the input to buffer.
There’s then a if-conditional check to see if make_me_not_zero is still 0. If it is, the process terminates; if it isn’t, we arrive at our desired destination in the binary which reads our flag out for us.
Intuitively, we can start to build our attack chain in reverse:
We want to get to the function call that reads out our flag.
To get to the above, we need to have make_me_not_zero not be zero by the time the if-conditional evaluates.
Since the program does not otherwise allow for us to set make_me_not_zero, we need to either overwrite it in memory or otherwise disrupt the control flow of the process.
Our only input to the process is along the scanf() call, so we’ll investigate what exploit opportunities exist around here.
Now many of you may not necessarily be professional exploit developers already (in fact, some of you may not have exercised secure coding practices in C more generally); understandably, the vulnerability may not immediately be apparent. But if we look into references for scanf(), we can see that it reads in from stdin with the “s” specifier standing for…
Any number of non-whitespace characters, stopping at the first whitespace character found…
“Any number of non-whitespace characters”?! But buffer only allocates for 300 int (300 * 4 bytes)! This adds affirmation to our above-described attack-chain that a buffer overflow may be possible.
OPTIONAL: Try using e.py!
Let’s test our assumptions! Open e.py and take a minute to look it over. When you’re ready, uncomment the following line:
payload = b’A’ * 1209
…and then run it from the 01_basic_overflow_1 directory with our dbg option:
python3 e.py dbg
Assuming you’re running this in the VM, you should see another terminal open running GDB with the pwndbg extension. Don’t worry too much about understanding what’s happening here for now; we have several exercises coming up in other stages that dive into all of this. In brief, you’ve launched a debugger and hooked it onto the flag process; that process has ran and is now paused at the start of the main() function. For now, enter “c” or “continue” and let the process resume running.
GDB will likely halt again, throwing a SIGSEGV segmentation fault. Examining the BACKTRACE log panel will show that our main() function successfully made the subsequent function calls necessary to read out the flag; there will also be error messaging informing you of your test’s success – though specifying you need to run your exploit outside of GDB. For us to do that, we’d want to re-run e.py without the ‘dbg’ option like so:
python3 e.py
Make sure you’ve uncommented the payload line, or it won’t work!
Again, don’t worry too much right now about understanding all of the information that GDB is showing you. We’ll go more in-depth with that in the section(s) to follow. For now, go ahead and close the GDB window (or type in “q” or “quit”).
Step A.3
Having developed our attack chain as a thought exercise and (optionally) affirmed our assumptions through GDB, we can now move on to exploiting the binary for our flag.
Using either e.py or the command line, run flag and pass at least 1209 characters to the program and receive your flag. Note if you run your exploit multiple times, you will get a different value each time. This is expected behavior and nothing to worry about.
Now enter that hash into your project_binexp.json file and submit it to Gradescope to confirm you’ve correctly walked-through the initial setup! Again, if you’re uncertain about the format for what project_binexp.json should look like, see the Submission tab to the left.
Common Pitfalls
Overview
In this part of the project, we’re going to focus more narrowly on some of the foundational aspects that undergird binary exploitation more generally. We’ll look at Intel x86 Assembly, using our tools like GDB to evaluate runtime statuses, and look to solidify our comprehension with the project environment before launching into the more exploit-centric material to come.
Learning Objectives
The core learning objectives for this section are:
- A baseline familiarity with Intel x86 Assembly.
- Utilizing GDB.
- C programming language comprehension.
Exercises
This section features 2 exercises:
01_bb_steps01_codeblox
Step B.1
Why are we interested in Assembly at all?
When you compile a source code file (such as flag.c), the compiler (like gcc) translates the high-level human-readable code into machine code that the computer’s processor can execute. A number of operations are performed at compile time (such as optimizing and linking), which obfuscates the binary’s original source code. However, we can still use a disassembler (like objdump) to translate machine code back into lower-level assembly instructions.
In practice, exploit developers generally do not possess the original source code of the binaries they research. But they can utilize tools to pour over and examine the assembly instructions – which can be just as good (provided you know how to read/contextualize assembly). Understanding what these assembly instructions are doing – both individually and collectively – is a fundamental baseline for reverse engineering (and by extension, exploit development).
Being able to read and comprehend assembly is often a labor-intensive process, especially if you’ve primarily been exposed to only higher-level languages before. We encourage you to lean into this challenge, however. Without fostering this aptitude, you’ll often be left in a position of brute-forcing/guesswork (being unsure what a process is doing or why your exploit is behaving a certain way).
If this is your first time seeing/engaging x86 Assembly be forewarned that you’ll need to be a quick study for this project. This section’s exercises are meant to help orient you more generally, but the sections to follow will require a firm understanding if you want to avoid getting lost.
In the table below, we’ve listed some of the common instructions you’ll encounter in the course of this project. At a high-level, assembly operations (e.g. mov, xor, ret, etc.) may have 0, 1, or 2 “arguments” to them depending on the particular operation – these arguments are referred to as “operands”. Depending on the instruction, the operand may be a value, something referential to the stack/heap, or a register. We encourage you to consult other reference material as needed to foster your comprehension.
One last thing worth noting about Assembly for this project is the syntax format you’ll be working in. This project is deliberately designed around x86_64 Intel Assembly. The “x86_64” in x86_64 Intel Assembly refers to the underlying instruction set architecture (for those in-the-know, it’s categorically a RISC architecture set, but there’s no real need to delve into that for this project); common alternatives you might encounter include ARM and MIPS (the former of which is commonly deployed on the M-series chipset found in modern Mac machines). The “Intel” in x86_64 Intel Assembly refers to the way the assembly is presented (the alternative being AT&T); consult for additional details on the difference(s) between the two.
Why are we interested in CPU registers?
Registers are part of a CPU’s architecture and are used to store data and perform operations. Assembly instructions make use of registers all the time (and by extension, the stack and heap – topics for another section). In the setup exercise (basic_overflow_1), you may have observed some of the registers and their contents at runtime within the GDB debugger like so:

In the above screenshot, the various R* values (RAX, RBX, RCX, etc.) in red along the left-hand side denote the CPU registers. The values immediately adjacent to them reflect what is presently stored in them. You’ll see that sometimes the register can hold referential addresses which point to other locations in memory (see RAX, RBX, RDX, RSI, etc.) whereas others contain the value itself (e.g. RDI, R8, R11, etc.).
You can always query the current value of a register in GDB. For example, let’s say we wanted to view the contents of RDI:
pwndbg> x $rdi
Throughout this course, you’re going to be working with 64-bit registers. Besides being different in size from 32-bit registers, there’s actually some important architectural differences that you’ll need to know as they relate to binary exploitation. More to-the-point, not all registers are used in the same way by the CPU. Function calls – for example – look at specific registers for things like function arguments. For now, we encourage you to perform independent research into RBP, RSP, and RIP as these will be very important in the sections/exercises to follow.
Step B.2: Exercise 1
01_bb_steps [5 pts]
Version: 51314d324d444d3149455a68624777674d6a41794e69427564577873
Resources
- See our
- https://www.cs.uaf.edu/2017/fall/cs301/lecture/09_11_registers.html
Challenge Instructions
This challenge is meant to be a soft introduction to using GDB; however, you are also welcome to calculate the values by hand in reading the source code (flag.c) if you so choose. We recommend using GDB if you have never done so before because of how extensively the remaining project exercises engage the tool.
We can begin by manually starting GDB and hooking it to the flag binary process like so:
cd ~/project/01_bb_steps/
gdb flag
We have extended the default vanilla GDB tool with in order to help with things like readability and utility. If you were instead to invoke the binary into GDB with e.py (python3 e.py dbg), you’d observe GDB open as a separate window (see FAQ for folks opting to SSH into the VM). Either way, the pwndbg prompt will wait for you to enter a command; let’s start by setting a breakpoint for the debugger to catch on:
pwndbg> b main
The above sets a breakpoint at the start of the main() function (Note: as a courtesy, all of your e.py files have this configured by default when you invoke the dbg option). Recall that all C-based programs start execution at main(), so we can reliably expect such a function to be present in all of our binaries for this project. Let’s now start the flag binary by running it:
pwndbg> r
Within the GDB interface window, you’ll likely see a flurry of text/blocks showing various things like stack traces, register printouts, code prints, and more. GDB will pause the process’ execution at the start of main() (where we set our breakpoint) and await for the next command.

If you look at the DISASM readout, you’ll note that we’re not quite yet where we want to be. Let’s go to the next instruction, call bb_steps:
pwndbg> ni
The call instruction makes a function call, in this case to the bb_steps() method. If we were to use n or ni now, we’d step over this to the mov instruction at 0x401295. We want to follow the control flow into bb_steps() instead, so we’ll step inside using:
pwndbg> si
After that, you will notice we are now in the bb_steps() function. We can now make larger “next” (n) steps (vs. the more granular “next instruction” or ni) which will traverse the code flow faster by logical instruction blocks. Go ahead and see how this progression synchronizes with the SOURCE (CODE) display readout until you hit the scanf() method.
You can (and should) also take some time to observe the changes in the registers that are taking place with each __asm() line from the source code.
pwndbg> n
At the end of the ASM instructions, you will be prompted to enter in answers for a couple of questions based on what you can read out from GDB. You can enter these into GDB if you want to; however, in order to get the official/valid flag for submission you will have to save your answers, exit GDB, and then enter them into a non-debug binary run, e.g.:
binexp@cs6035:~/binexp/01_bb_steps$ ./flag
What value is currently in RBX?: 0x<valid_answer_here>
Upon correctly answering the questions, you will see your flag printed out, which you can copy into the json file!
Common Pitfalls
Step B.3: Exercise 2
01_codeblox [5 pts]
Version: 51314d324d444d3149455a68624777674d6a41794e69427564577873
Resources
Challenge Instructions
Using the limited menu of assembly instructions, construct a working call to attain the flag. This exercise does not introduce anything particularly new, but unlike some of the other exercises you will need to perform some basic hexadecimal arithmetic in order to attain the flag.
One of the first things you’ll want to do is figure out the target address you want to go to. Try reading the source code (flag.c) and seeing where – logically – that might be; where in the source code is the program constructing a call that would get you the flag? When you’ve identified what looks appropriate, try dumping the instruction set for the binary using objdump:
objdump -D flag > flag.asm
You can then read/search/parse through the generated flag.asm file to look for an appropriate address that lines-up with where you want to go; try looking for the function name(s) to help narrow down your search. Alternatively, you can use GDB and query the addresses directly.
Once you have your target address, you’ll notice the menu doesn’t let you set a register directly – each option only adds or subtracts a fixed hexadecimal amount (or zeroes it out entirely). You’ll need to work out what combination of these operations (and how many times you select each one) lands you on the exact value you need. Also pay attention to what the other register involved starts as, and how the final menu option combines the two registers together – that relationship is what determines where your call actually ends up.
Common Pitfalls
We believe in you!
Overview
Now we get into the meat-and-potatoes of the binary exploitation project!
Recall in Stage 0 what we did in the guided exercise of 01_basic_overflow_1: we learned how C could be a memory-unsafe language. More to-the-point: we performed a buffer overflow, thereby overwriting a variable (which altered the code flow of the process). It turns out that this kind of vulnerability can extend to overwriting other areas of the execution stack as well. In this section, we’re going to have our first look at stack-based overflows and learn the building blocks that will enable us to tackle more challenging exploits.
Learning Objectives
The core learning objectives for this section are:
- Understanding the stack and stack-smashing comprehension
- Working with pwntools and basic exploit development
- Foundational considerations for code flow redirection
Exercises
This section features 2 exercises:
01_basic_overflow_202_looper
Step C.1:
What is the stack? Why do we care about it?
In computer science, the stack is a contiguous block of allocated memory. As functions get called, said function’s variables get memory allocated on the stack; as the function call is resolved, the memory for the variables are de-allocated and removed. Helping organize and control this process are the RBP and RSP registers, which store the base pointer and stack pointer values, respectively. These pointers help reference either end of the stack frame and are useful both for pushing/popping values on/off the top of the stack (RSP) or referencing local variables (RBP).
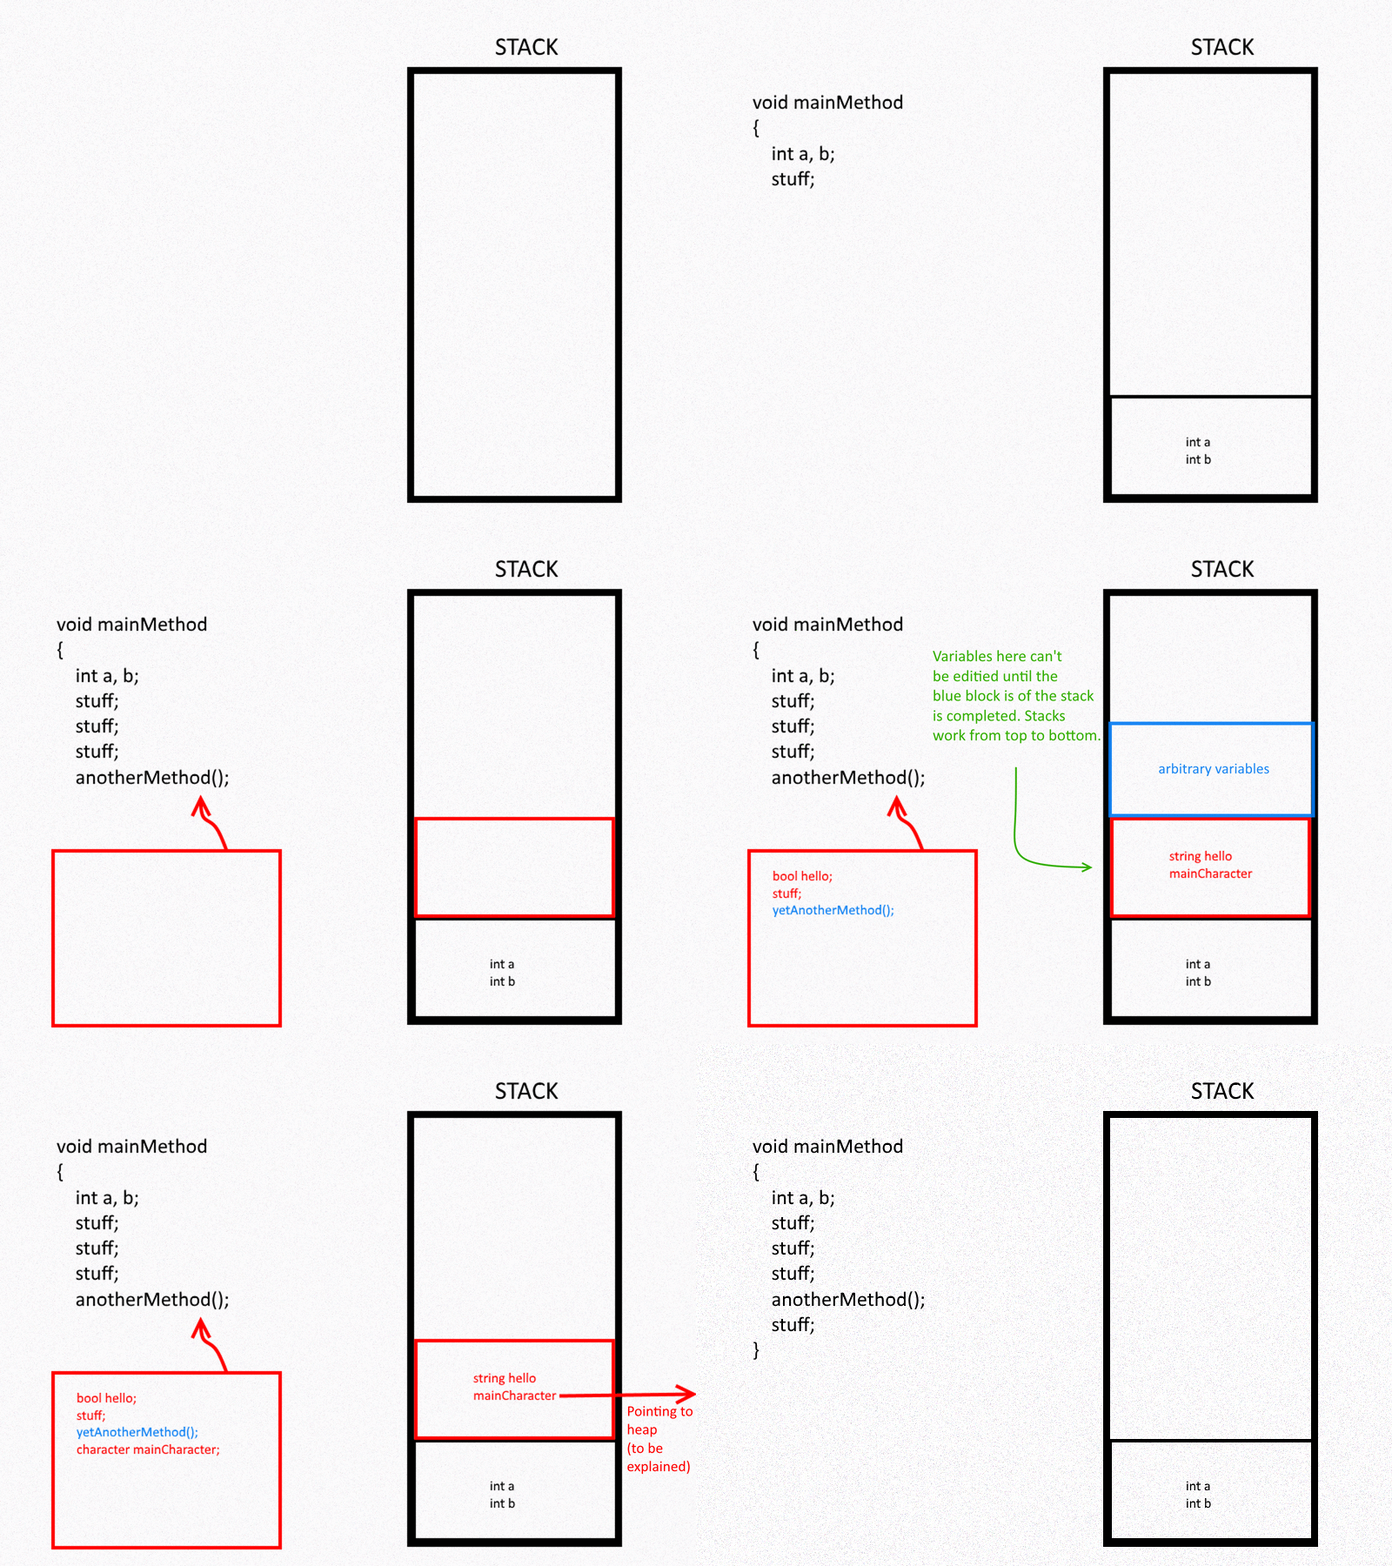
For the purposes of binary exploitation (and by extension, this project), this is useful to us in a lot of different ways. We’ve already seen how overflowing the stack can allow us to overwrite local variables contained within that particular function’s stack frame; but the real utility from this comes from writing into other stack information.
Consider what was described above: when a function call is resolved, it executes a ret assembly instruction to return the execution flow back to wherever it was originally invoked from: that destination is preserved in the stack! Since we’re already overflowing other values in the stack, we can likewise overwrite the destination that the ret instruction goes to!
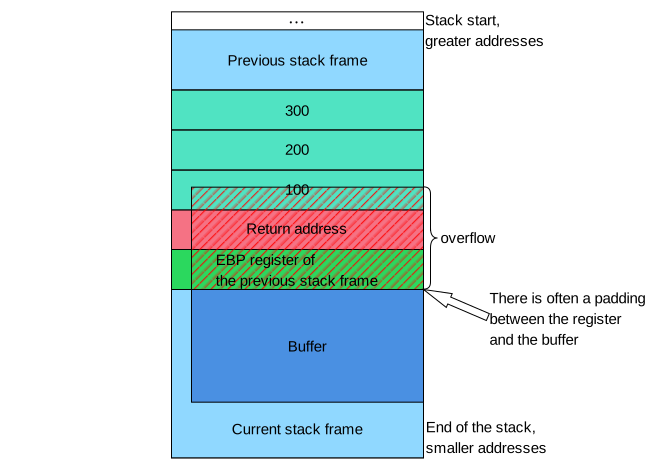
What’s the danger?
Now all of the above can feel quite abstract – especially if you’ve only ever learned about buffer overflows (or similar memory-based attacks) in academic textbooks. But there’s actually substantial security risks in being able to hijack a process’ control flow at runtime.
In all of the exercises that follow, we merely direct you to exploit the binary into reading from /proc/flag. But we could – in theory – make these binaries do anything we wanted under the EUID of the process (binuser); that’s not particularly useful/threatening in our case (since binuser has similar privileges as the user you’re already logged in as, binexp), but imagine the risks that poses for a vulnerable process running under elevated privileges; if we were to exploit a process running as root (or Administrator, in Windows parlance), we could force the process to perform actions as root. This goes without even addressing the potential harms to what the software itself is responsible for (one could only imagine the potential impacts that could happen to software responsible for payroll or critical infrastructure, for example).
And before you go writing buffer overflows out as yesterday’s news – .
Again however, we’re not going to be going that far in this class; these exercises are merely meant to get us acquainted with this class of vulnerability and comfortable with exploiting it at a basic level.
Step C.2: Exercise 1
01_basic_overflow_2 [5 pts]
Version: 51314d324d444d3149455a68624777674d6a41794e69427564577873
Resources
- See our
e.py(see the Instructor’s Note in the code comments)
Challenge Instructions
In this task you will learn details about binaries compiled from C code (with gcc) in a Linux environment, and how some basic things can be exploited such as process redirection or control flow hijacking. We strongly encourage students consult the intro video included in the resources section above to help orient you to the task more generally.
For this task you have an executable binary named flag which is vulnerable to a buffer overflow in one of its functions. We will be using a Python exploitation library called pwntools to automate some of the overflow techniques and get the binary to call a function it otherwise wouldn’t have. This function called call_me() generates a key using your Gradescope User ID to get a valid flag that you will ultimately write to your project_binexp.json file for grading.
Now we will run the binary just to see what the program is doing:
$ cd ~/project/01_basic_overflow_2
$ ./flag
We see the binary is asking for a string. Input any text you want or just press enter and you’ll (likely) see that the program does nothing and just exits. That would align with our expectations from reading the source code (flag.c). If we look into the function, we can learn…
read() attempts to read up to count bytes from file descriptor fd into the buffer starting at *buf
Oh no! In this case, read() will write up to 1000 bytes into the buffer, but buffer is only sized for a lesser amount. As we learned earlier, a buffer overflow occurs when too much data is fed into an unprotected (or poorly protected) data buffer; it would appear that flag is vulnerable to a buffer overflow.
DEVELOPING THE EXPLOIT
Open e.py with your preferred text editor (the VM comes with xed by default) and analyze the content and comments. Once you understand what they do, proceed to uncomment the code in Part 1 and fill out the cyclic() size. What size do you need to make payload in order to trigger the segmentation fault from the buffer overflow?
After this, run the exploit through GDB:
python3 /home/binexp/project/01_basic_overflow_2/e.py dbg
This will open up a GDB terminal with a breakpoint set at main(). Within that terminal, pass the “continue” or “c” command to resume the process execution.
Note: the above screenshot is intended to be demonstrative; your actual values may not match what’s shown. If you’re not seeing the ret instruction overflowed with cyclic() data, you may need to increase the size of your input (perhaps considerably so!).
We see the program received an interrupt signal for a SEGMENTATION FAULT (SIGSEV, or an invalid access to memory). This happens when the program tries to access memory at a certain location that it either isn’t allowed to access, or doesn’t exist. In this case the return address for the function was overwritten by cyclic()’s data in the form of a long string of character bytes. Pay attention to the bottom of the screenshot where the instruction pointer is currently trying to ‘ret’ (return) to 0x6561……616b which is just a string of in hexadecimal form.
Now that we know how to break the binary, let’s figure out how to be a little more deliberate/purposeful. Using a pwntools method called cyclic_find() we enter in the bottom 32 bits (4 bytes) of the return string (in the screenshot, the example is 0x6561616b) which will give the number of characters before reaching that value. By knowing exactly how much input we need to overflow our target, we can – in theory – overwrite the target with an arbitrary alternative, thereby hijacking the control flow.
Need more insight into the above? Try checking our FAQ for more details on
cyclic()andcyclic_find().
Returning back to e.py, go to “Part 2” in the code comments and update the value for offset based on what you’re seeing from above. Our goal at this step is to validate that we do – in fact – have total control over our target in memory. You might be tempted to skip this step, but you run the risk of simply assuming you’re correct when you’re not; many students have lost hours/days of project time troubleshooting exploits in other exercises because there is something amiss with their offset.
After you have done that, rerun e.py with the dbg option – ensuring to (c)ontinue again when the pwndbg terminal opens again.
If done correctly, you should see something like this screenshot. If you check the ret instruction, we are now failing on an invalid access to our dummy address.
Stepping away from the pwntools library for a moment, we now need to find something usable within the binary that will allow us to actually call a function or do something other than just crashing the program.
Now we will use a linux command objdump which takes a binary file and will output a dump of the binary’s assembly. The -D flag will output binary addresses, machine code, and assembly code of the binary into a file.
objdump -D flag > flag.asm
Then open flag.asm.
You will see a bunch of (likely) confusing information that – at a high level – translates to the code that you can see in the flag.c file. You aren’t going to have to go through this file at length (unless you want to); we are just going to focus on finding an address within the binary file that holds the machine code responsible for reading from /proc/flag. Search flag.asm for call_me in order to find corresponding assembly instructions.
The last part of this exercise is figuring out which assembly instruction is most apt to jump to. Leverage what you learned in the previous Stage, the linked materials in the “Resources” section, and try to determine where it would be best to ret to! When you’re ready, update “Part 3” in the e.py file and run your exploit:
python3 e.py
Common Pitfalls
Step C.3: Exercise 2
02_looper [10 pts]
Version: 51314d324d444d3149455a68624777674d6a41794e69427564577873
Resources
- https://www.asciitable.com/
Challenge Instructions
In this task, you are performing another buffer overflow (or maybe several!) in order to break out of a while() loop.
Here’s some suggested guidance:
- There’s a couple of things at work here, so – as always – carefully read the source code to understand what is going on.
- The ideal way to exit the
while()loop is to have theflagandbreakervariables match. Since they do not align by default, this means either one or the other (or both) will need to be forcefully overwritten/set. But how? - The developer of this binary thought they could protect against buffer overflows by constraining user input in a
struct; this isolatesflagandbreakerfrom being directly overflowed (at least insofar as what has been seen in similar challenges). Furthermore, they added a kind of “canary” within the struct (checkme) to help assure data integrity within the struct. Does this prevent the buffer overflow from happening? - Even if the struct were to become compromised,
breakerhas a couple of other tricks in place to mitigate a buffer overflow. But can these also be accounted for?
3
Overview
It’s been a few years since “” was originally published; since that time additional binary protections have been enacted to mitigate the dreaded buffer overflow. This includes things like:
- Address Space Layout Randomization (ASLR), which randomly arranges the address space positions of key data areas of a process.
- The No eXecute (NX) bit (otherwise known as Data Execution Prevention – DEP), which marks certain areas of the program as not executable (including the stack).
- …and much, much more.
But this hasn’t stopped buffer overflows from being problematic. Return-Oriented Programming (ROP) is a technique that was developed to otherwise bypass these and other controls. At its heart, ROP makes use of snippets of code that already exists within the binary – so called “gadgets” – in order to manipulate the code flow.
Learning Objectives
The core learning objectives for this section are:
- Understanding function calls within 32- and 64-bit systems
- Working with ropper and understanding gadgets
Exercises
This section features 2 exercises:
02_dialtone03_madness
Step D.1:
So what are ROP gadgets?
At its heart, the “return” in “return oriented programming” is what defines every gadget out there. If you were to dump the assembly instructions from these binaries (e.g. using objdump), you would find any number of instruction sequences that terminate with a ret instruction. By jumping into these instructions, we allow for some atomic, register-oriented actions to take place before the ret instruction hits, thereby returning the execution flow back to the stack (which we ideally control, given our stack-based overflow techniques).
As an exercise, try dumping the assembly from our first problem in Stage 00 and CTRL+F search through the resulting flag.asm file for instances of the ret instruction:
objdump -D ~/binexp/01_basic_overflow_1/flag > flag.asm
Now – obviously – manually parsing through an objdump for a list of operations preceding ret is quite tedious; this is compounded by the fact that not all instruction sequences are necessarily useful to us. Fortunately, we have a tool available for us to quickly identify all number of gadgets on our behalf: ropper!
As a follow up, try using ropper on the same binary:
ropper --file ~/binexp/01_basic_overflow_1/flag
Do the addresses match?
In essence, we’re still performing jumps to areas in code – much like how we were in the stack smashing portion; only this time, we’re additionally leveraging these gadgets to do some setup and register manipulation in order to allow us to get some other malicious actions done.
So how are function calls made?
Thus far, you’ve seen at least one example for how functions are called through assembly instructions and registers: recall the call instruction, which we’ve looked to several times in the past several exercises.
Up until now however, you’ve probably not thought about the structure/setup that these function calls have had to observe. What happens – for example – when a function has an argument (or two+)? Here is one difference between 32- and 64-bit architectures that’s worth noting. In 32-bit architectures, these arguments are pulled from the stack; by contrast, in 64-bit architectures, these values are referenced from the registers.

So, for example, when foo(bar,baz) is invoked in a 32-bit system, we’d want a payload looking something like:
payload = cyclic(...)
payload += p32(foo)
payload += p32(pop_pop_ret_gadget)
payload += p32(bar)
payload += p32(baz)
In the above example, first the function call to foo() is crossed in the stack. When that function call is made, the very next value in the stack is considered the return address; in this case, we’ve overflowed it as being an arbitrary pop_pop_ret gadget (I say “arbitrary”, because it largely doesn’t matter which registers – save for reserved ones like EIP, ESP, and EBP – will hold the removed values in 32-bit systems). The next values in the stack fit the sequential order of arguments expected (first bar, then baz). In this case, we’ve used the particular gadget because of how it will remove bar and baz from the stack after execution by “popping” them; this sets us up for sequential function calls as needed (aka ROP chaining).
There’s a subtle difference when it comes to 64-bit systems like the VM the project is hosted on. In those kinds of systems, you want to lead with the ROP gadget first. This is because it’s necessary to stage the arguments for the function before it’s called. Moreover, we need to be quite selective about which ROP gadgets we reach for (vs. the more arbitrary choices in 32-bit systems); this is because functions will look to specific registers for their values (starting with RDI for the first argument). More generally, you’d want your payload looking like this:
Assuming that the initial address you overwrite in your buffer overflow is a “pop” gadget, the code flow will…
- (ret)urn to the pop gadget, popping the arguments off the stack and into the respective registers.
- At the end of the gadget, it will (ret)urn again – this time to the address of the function in question.
- When the function ends, it will (ret)urn back to whatever’s next in the stack; if we’re chaining ROP calls, this would mean going back to step (1).
Step D.2: Exercise 1
02_Dialtone [10 pts]
Version: 51314d324d444d3149455a68624777674d6a41794e69427564577873
Resources
Guidance
In this exercise, we’re going to layer our understanding of ROP with an introduction to system call (syscall) operations.
Up until now, exercises in this project have largely involved an invocation of the system() command (generally of the form system(‘cat /proc/flag’)). However, the system() function is – at its heart – a specific C library method; for a variety of reasons, that particular method may or may not be available when developing an exploit for a vulnerable binary. So what are we meant to do then? What is a syscall? A syscall operation is a mechanism for interacting with the underlying kernel. Programs make use of syscalls in requesting a service from the operating system; there are hundreds of such services that a program might request on Linux. Anything from killing a process to adjusting a process’ UID are available.
For the purposes of binary exploitation and the development of your exploit, constructing a syscall is similar to invoking any other method with a few key differences:
Like other function calls, syscalls in 64-bit systems make use of registers to house arguments. The first three registers are the same as a function: RDI RSI RDX The next three registers differ. Instead of using RCX, R8, and R9 for the 4th – 6th argument respectively, they use in-order: R10 R8 R9 All syscalls make use of the same assembly instruction: syscall. In order for the OS to understand what kind of syscall is being requested by the user process, it looks at the value of the RAX register: If the value stored is 0, it’s a read syscall If the value stored is 1, it’s a write syscall If the value stored is 2, it’s an open syscall Etc. For a complete index of which RAX values correspond to which syscall operations, consult the linked reference(s), above.
Challenge Instructions
Read over the flag.c source code and execute a basic buffer overflow to hijack the control flow of the process. Note the available global variables and gadgets available in gadgets() Using ROP chaining, construct a series of syscalls which ultimately perform the equivalent operation of system(“cat /proc/flag”) Unfortunately, no single syscall can do this on its own. You’ll need to chain together multiple syscalls in order accomplish this. You might be tempted to reach for the execve syscall as a kind of single-shot invocation, but our flag generator will recognize this shortcut. While you may be able to engage some of the other/more complex syscalls to accomplish this, we encourage you to just use the read, write, and open syscalls (though not necessarily in that order). If this is your first time working with syscalls, we strongly encourage you to review the linked resources at the top of this exercise, which – among other things – provides specificity as to what the arguments should look like for each respective syscall.
Step D.3: Exercise 2
03_madness [15 pts]
Version: 51314d324d444d3149455a68624777674d6a41794e69427564577873
Resources
Guidance
Thus far, a lot of your exploits rely on a convenient, single-shot overflow (i.e. write once, overflow once). While many buffer overflow exploits present themselves as such, we should be cognizant that vulnerable code can emerge in many different ways; sometimes, a buffer overflow is only somewhat exploitable. That’s the case in this exercise.
Instructor's note: Typically when we discover such a vulnerability, we might turn to technique like . That’s not the intended case for this exercise and is beyond the scope of what this is meant to teach; that said, you are more than welcome to read up more on that technique if desired.
This is a ROP exercise which creatively applies lessons learned in previous Stages (along with the above takeaways from Stage D itself). You won’t need any of the extended techniques you may have been exposed to in Stage E (e.g. stack pivoting) — but you will need to think about ROP chaining a little more creatively than you have before.
The biggest challenge you’re likely to encounter is figuring out how to build your complete ROP chain. It is possible to build a complete ROP chain of appropriate length to invoke a system("cat /proc/flag") call, but there’s a bit of legwork you’ll need to do to make that happen.
Challenge Instructions
-
- Review the flag.c source code and identify the vulnerability present in the binary.
- In your analysis, see if you can identify how you might construct a call to system(“cat /proc/flag”).
- Note the global variables and available ROP gadgets included in gadgets(). How might they be useful?
- Perform a basic buffer overflow and hijack the binary’s control flow.
- Leverage ROP chaining in order to invoke a system() call to read out from /proc/flag.
- To do this, you’ll need to first build the appropriate argument (“cat /proc/flag”) before passing it to a system() call.
- You’ll notice that there aren’t any convenient pop rdi, pop rsi gadgets laying around. You’ll instead need to construct their equivalent operations using the available gadgets in gadgets(). Note: you’re welcome to use any other ROP gadgets discovered by tools like ropper, but this exercise is solvable using only the ones within gadgets().
- Even if you do the above, there is a limit to your ROP chain imposed by the read() call that you’ll need to workaround.
- Control flow doesn’t have to leave
attempt()for good once it returns. Consider what happens if your ROP chain returns back into a function that will accept more input from you — and what register state might survive that trip. We leave it to you as an academic exercise to understand how you can overcome this hurdle.333333
-
- Step E.1
- Step E.2: Exercise 1
- Step E.3: Exercise 2
- Step E.4: Exercise 3
- Review the flag.c source code and identify the vulnerability present in the binary.
Step E.1
Welcome to the final section of the Binary Exploitation project! We reserve this section semester-over-semester for more advanced topics as well as binaries that we feel help extend student comprehension over the prior sections. Topically, the exercises do not necessarily relate to one-another and thematically should be approached as being distinct in their learning objectives.
Exercises
This section features 3 exercises:
-
-
03_chirp03_ransom_flagenc & 03_ransom_alt03_ouroboros
-
Step E.2: Exercise 1
03_chirp [15 pts]
Version: 51314d324d444d3149455a68624777674d6a41794e69427564577873
Resources
Challenge Instructions
There have been a number of defensive upgrades made to binary security over the years designed to protect against memory corruption vulnerabilities like the stack-based buffer overflow.
In this challenge, we’ll cross-examine a few in particular: stack canaries and PIE.
WHAT ARE STACK CANARIES?
When you’ve been performing basic buffer overflow exploits to hijack the control flow of a binary, this has typically been done by simply overwriting the ret address stored in the stack that the function’s instructor pointer would reference.
Stack canaries frustrate this process by doing a couple things:
-
-
- At compile time, the source code is slightly modified around these ret operations; the compilers inject some additional operations in order to protect/preserve the integrity of the address referenced by the
retoperation. - The way that the address is protected is that a runtime-determined random value (aka the “canary”) is inserted in-between that address and the rest of the calling function’s frame. When the function terminates, that random value is checked by the binary to determine if it’s changed; if it has, then the binary presumes that an overflow has taken place and terminates the whole process.
- At compile time, the source code is slightly modified around these ret operations; the compilers inject some additional operations in order to protect/preserve the integrity of the address referenced by the
-
There are a few rules/behaviors that stack canaries follow that are worth being mindful of.
-
-
- In our 64-bit system, stack canaries are always sized 8 bytes.
- Stack canaries are set when the program starts up and do not change after. The same stack canary is even passed along to any child processes it spawns (i.e. they do not create their own stack canaries). Stack canaries are only reset when the process restarts.
- The relative position of stack canaries within the stack do not change run-over-run (though the absolute address may change due to things like ASLR); stack canaries will always be positioned between all other variables within a function and the return address.
-
WHAT IS PIE?
Position Independent Executables (PIE) is a hardening measure that binaries can likewise embrace at compile-time. In brief, PIE randomizes the address space of the binary’s assembly at runtime making it practically impossible to statically reference particular instructions in our exploits.
Below is a screenshot of the same binary objdump compiled with and without PIE:

In the case of the PIE-compiled binary, instead of addresses the objdump dumps offsets.
Like stack canaries, PIE has a few rules/behaviors that are worth being mindful of:
-
-
- At runtime, a PIE base address is randomly set and all of the binary’s instructions are offset from that base address. Each individual instruction is not seeded with its own randomized value, but are instead offset from this base address.
- The PIE base address typically ends in 000 due to memory pages being the units of randomization, sized at 0x1000 bytes. For example, it might look like: 0x5b930239a000.
-
MEMORY LEAKS & FORMAT STRINGS
On their face, both of these protections may seem insurmountable:
-
-
- We don’t know the value of the canary at runtime, so overflowing it with anything other than itself will prevent our exploit.
- We don’t know the value of the PIE base address at runtime, so even if we were to correctly set the canary, we couldn’t reliably execute other code in the binary.
-
The big condition on both of the above is that we cannot know these values. If we did, then we could overcome both of these problems. This is why vulnerabilities like memory leaks are very concerning.
Memory leaks can manifest in a number of ways, but one of the most common is by way of format-string vulnerabilities. When printf() is called to print a string, it doesn’t simply print the string; it goes to an address on the stack and prints the contents that address points to. If printf() implicitly trusts user input…
…then the user can forcefully decide what type of data is being rendered by printf(). As an example, this might look like…
userinput = "%x" → printf(userinput) → printf("%x")
This is a problem! By passing a format specifier (%x) as a placeholder value but not specifying what’s meant to go there (i.e. printf("%x", somevariable)) the printf() function by default reads values off of the top of the stack instead. We can leak multiple sequential values (e.g. “%x %x %x %x…”) or even particular values (i.e. the 5th value via “%4$x”).
Note: the “%x” format specifier returns hex representations of whatever’s next off the stack, but there are other format specifiers we might choose to use instead that may be more useful/insightful.
Using this mechanism, you can leak the stack memory at runtime which – as we mentioned earlier, sets us up to compromise the binary in its entirety.
Guidance
-
-
- Your goal for this challenge is to exploit a format-string vulnerability in order to leak both the stack canary AND a PIE address, then perform a buffer overflow.
- You can use GDB to identify any canaries and the PIE base address. This is useful in affirming that you’ve correctly identified/calculated them through a memory leak. The GDB commands are:
canarypiebase
- By default GDB disables ASLR, which affects PIE behavior. If you don’t change this, you might be stumped as to why the PIE base address always appears as something like 0x555555554000. If you want a more representative experience, you need to turn this feature off before running the binary in ASLR with the following GDB command:
set disable-randomization off
- Because setting breakpoints at random addresses is practically impossible, you can instead make use of setting breakpoints by offset in GDB via:
breakrva 0x<offset>- As an example, we can break on the “call” operation from the earlier screenshot with
breakrva 0x17f0.
- Addresses that start with 0x7ff generally (but not always) are associated with external library functions (i.e. libc). These are NOT useful in calculating your PIE base as they are separately randomized.
-
Step E.3: Exercise 2
03_ransom [10 pts + 10 pts]
Version: 51314d324d444d3149455a68624777674d6a41794e69427564577873
In this task, we’re going to (loosely) reverse engineer some faux ransomware (instructor note: this isn’t actually ransomware; the binary is harmless to your VM and host system).
You’re presented with the following files:
-
-
flag.enc: This is theflagbinary (compiled fromflag.c) but it’s been encrypted by thealtbinary! You need to figure out a way of decrypting this in order to run it and retrieve your flag.alt: This is the ‘ransomware’ that was used to encrypt theflagbinary intoflag.enc. You need to reverse engineer and exploit this binary in order to decryptflag.enc. It was compiled fromalt.c.
-
Understandably, this is a bit of a tougher task than what you might have approached previously. So here’s some suggested considerations:
-
-
- The
altbinary uses DES to encrypt/decrypt files. However, you do NOT need to understand the underlying workings of DES in order to solve this task. We’ve abstracted away the encryption/decryption code itself for this reason. Cracking/breaking DES is not the intended approach and falls outside the scope of this challenge. - If it’s helpful, you can encrypt other files using
altto better understand what’s happening, if you’d like. Don’t worry –altactually just makes an encrypted copy of the original, so you’re not at risk of genuinely harming your system/data unless you delete the original version. Usingalton a test file and then comparing the two might be insightful. Linux has all kinds of tools available to that end:- ls -l
- xxd
- stat
- hexdump
- od -Ax -tx1z
- chmod –help
flag.encwas encrypted using an 8 byte key (e.g. “aaaabbbb”). One of the first things you’ll need to do is figure out what this key is; without this key, you will not be able to decryptflag.enc. We recommend usingalt’s encrypt functionality on some test files and observing what becomes of your known keys; what doesaltdo with the key after encrypting the binary? Try examining your encrypted files in some of the ways mentioned above.- Once you’ve found the key, you need to figure out a way to decrypt
flag.enc. Once again, examining the source code ofaltwill likely lead you to some ideas for how you might go about this. - When
altdecryptsflag.enc, it will be output asflag.enc.dec. If it was decrypted correctly, then you should be able to set the execution bit (see chmod, above) and run it to attain the flag hash. - There are actually 2 flags for this challenge:
- The first flag comes from pwning the
altbinary. This is within thedeadcode()function in thealt.csource code. That flag belongs in the03_ransom_auxspot in yourproject_binexp.jsondeliverable. - The second flag comes from successfully running the decrypted version of
flag.enc; that flag belongs in the03_ransom_flagspot in yourproject_binexp.jsondeliverable. - For full credit on this task, you need to submit both hashes in your JSON submission.
- The first flag comes from pwning the
- The
-
Common Pitfalls
Step E.4: Exercise 3
03_ouroboros [15 pts]
Version: 51314d324d444d3149455a68624777674d6a41794e69427564577873
Resources
-
-
- TBD
-
Guidance
In this exercise, we’re going to be building on our ROP comprehension by introducing a new technique: stack pivoting! In brief, stack pivoting is a means for hijacking the process’ stack pointer (RSP), thereby changing what the process is viewing as the current stack. Why is this useful?
In other ROP exercises, you generally have to perform a standard buffer overflow in order to hijack the control flow of the process; once you had, ROP would have you chain together a circumstantially-dependent number of ROP gadgets, ultimately leading to invoking some function(s) that would lead to the flag. That’s all well-and-good, but what if your overflow is constrained (i.e. you don’t have enough space in memory to write out a complete ROP chain)?

This is where stack pivoting is handy. Since we cannot continue to load-up the stack with our gadget chain after the ret address (like we usually might), we need to find somewhere else to write our ROP chain and then relocate RSP to point to it. Where you write the gadget chain to depends on the binary, though it’s typically one of the following:
-
-
- The .bss or .data segments of the binary (if writing to an (un)initialized variable in memory).
- The heap
- Elsewhere within the stack
-
Now how do we do this? Well – since this is a ROP exercise – let’s consider some gadgets!
EXAMPLE STACK PIVOT GADGETS
pop rsp
This one should come as no surprise to you; if we can pop an address off of overflowed memory, then we can write the location of our gadget chain directly to RSP.
pop <reg>; ret;
xchg <reg>, rsp; ...; ret;
This is a pair of gadgets; the first one is substitutable with any gadget(s) that ultimately grant you control of a register targeted by the xchg operation. , the xchg operation swaps the values of contents stored between its operands. In effect: you write your gadget location to one register (specified by whatever \<reg\> is), then swap it into RSP.
leave; ret;
This one can be deceptively tricky to understand, but a really common gadget present in compiled binaries. This gadget is typically found at the end of every function (besides main()), in order to preserve the callstack between functions. The leave operation sets RSP to be whatever RBP is. Next, it pops the top of the stack into RBP. Finally, the ret operation pops the return address from the stack and jumps there.
In this case, our goal is to be able to overflow RBP (which is not atypical for a buffer overflow and also stored in the stack):

RBP gets moved into RSP, and then the rest is history!
Challenge Instructions
To complete this challenge, you’ll need to keep the following in mind:
-
- First, read the source code and understand how the binary is vulnerable.
- Perform a buffer overflow and hijack the process’ control flow during runtime.
- Identify an appropriate location to write your gadget to, then find and leverage a stack pivot gadget to relocate the stack.
- Finally, assemble a simple ROP gadget chain to attain your flag.3
3
Submission Details
- Submission Details
- FAQ
- Q1) What does a flag look like?
- Q2) Do I need to submit to both Gradescope and Canvas?
- Q3) How many attempts can we submit to Gradescope?
- Q4) Once I submit to Gradescope, when will I get my grade?
- Q5) Do I get partial credit for passing some tasks?
- Q6) How late can I submit to Gradescope?
- Q7) Can I get an extension on my project deadline?
- Q8) Gradescope isn’t recognizing my flag as valid; what do I do?
- Q9) Gradescope timed-out processing my submission; what do I do?
- FAQ
Your grade for this project will be handled through Gradescope. You will submit just one file: project_binexp.json, which you should receive as an unfilled template on your VM. If you did not – or cannot otherwise locate it – below is the template that you can copy:
{
  "01_basic_overflow_1": "INSERT FLAG",
  "01_bb_steps": "INSERT FLAG",
  "01_codeblox": "INSERT FLAG",
  "01_basic_overflow_2": "INSERT FLAG",
  "02_looper": "INSERT FLAG",
  "02_dialtone": "INSERT FLAG",
  "03_madness": "INSERT FLAG",
  "03_ransom_flagenc": "INSERT FLAG",
  "03_ransom_alt": "INSERT FLAG",
  "03_ouroboros": "INSERT FLAG",
  "03_chirp": "INSERT FLAG",
  "ec_hatchling": "INSERT FLAG",
  "ec_recall": "INSERT FLAG",
  "ec_typewriter": "INSERT FLAG"
}
NOTE: To ensure that the autograder accurately grades your submission, you should create your .json file in a text editor on the VM and submit from the VM. Do not use a word document program like LibreOffice or Word. The submission must be proper json format for the autograder to give credit.
FAQ
Q1) What does a flag look like?
Flags are produced in reading out from /proc/flag on the VM. They are a long sequence of hex characters. An example of a flag is shown in the screenshot below:

In the above example, you would copy the portion between the “Start FLAG” and “End FLAG” delimiters to the appropriate <copy flag here> spot in your project_binexp.json file.


