Description
General description:
The final project involves the analysis of a data set that you are being provided in which you will build a statistical model and then write a report summarizing your work. The report should be no more than 6 pages of text summarizing how you approached analyzing the data, how you made
various modeling choices, and the substantive conclusions of your modeling efforts. Projects are to be carried out either on your own, or in groups of up to four students.
Initial steps:
If you want to carry out the project with other people, you should begin the process of identifying other students with whom you want to work. I would like this process to be completed at latest by Friday, April 5. Once you have settled on the group of students involved in the project, please
e-mail Sanqian Zhang ([email protected]) to let her know of your group. She will create project groups on Canvas so that you will only need to upload the project once for the entire group.
Data description:
The goal of this project is to use the modeling methods you learned in the course (and possibly an occasional application of related methods) to analyze a data set described below. The data set includes information on heart attack patients discharged from all of the hospitals in New York state in 1993, where the admitting diagnosis was an Acute Myocardial Infarction (AMI), also called a heart attack, who did not have surgery. There are 12,844 cases in the data set. You can obtain the data set (called amidata.csv) from the data set folder on the course Canvas site.
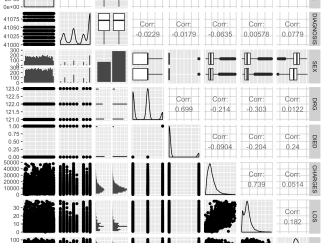
The data consist of the following variables:
- Patient (patient ID, numbered 1 to 12,844)
- DIAGNOSIS (a 5-digit code referring to the International Classification of Diseases, 9th Edition, also known as the ICD-9 code, which indicates the part of the heart that was affected)
- SEX (F for female, M for male)
- DRG (a code indicating the Diagnosis Related Group – can be one of the three following codes)
- 121: for AMIs with cardiovascular complications who did not die.
- 122: for AMIs without cardiovascular complications who did not die.
- 123: for AMIs where the patient died.
- DIED (1 for patients who died in the hospital, 0 otherwise)
- CHARGES (total hospital charges in US dollars – note that some of these values are missing)
- LOS (hospital length of stay in days since admittance)
- AGE (age of the patient in years)
The data were provided by Health Process Management, Doylestown, PA.
Your task is to model the hospital length of stay as a function of the other variables that you think are relevant. This task will almost certainly require the following elements:
- Identifying variables that are categorical versus quantitative.
- Exploratory analyses of the data to help inform modeling decisions.
- Making reasonable choices for the modeling the response, and for the way in which the predictors are included (e.g., on their original scale or possibly transformed to another scale). • Iteratively improving your model results, possibly through different modeling decisions (e.g., considering different interactions).
- Making sense out of the relationships you find between the response and the predictors.
Instructions for written report:
The main goal of the written report is to explain the process of analyzing the data, the logic you followed that led to investigate different modeling choices, and substantive conclusions you learned as a result of the modeling task. The text should be no more than 6 pages of text. The six pages can be single-spaced if you like, but please use a font size no smaller than 11pt. You are encouraged to include graphical and tabular summaries where appropriate (these do not count against the 6 pages of text) which can be included as an appendix. Attaching code is not necessary, but you may find it helpful to insert an occasional code chunk if it helps illustrate particular analyses you performed.
You are free to write the summary as you wish, but one way to organize the written summary is in the following manner:
- Have your introduction lay out a description of the problem and its importance, a description of the data you are analyzing, and the goals of the project.
- A follow-up section can summarize the results of exploratory analyses of the data, describing key features of the data that will be relevant for your modeling efforts. Any data pre-processing steps should be discussed here.
- At this point, you should describe the main models that you considered, and your decisions to consider alternative models. This section could finish with an explanation of the model or models that you feel are adequate in relating the response to the predictors.
- Based on the modeling from the previous section, you should describe the substantive conclusions that would be important for a non-statistician (likely a medical researcher or health economist) to understand. You may want to consider and report any pragmatic advice or conclusions that result from the analysis.
- The report can conclude with not only a brief overview of your work, but also a critical evaluation of your overall approach. What aspects of your modeling attempts did you expect would substantially improve inference but did not achieve the desired outcome? What limitations can you offer about your results, or the process that led to your results?
Project Grade
The project is worth 30% of your final course grade. If working on a team, all team members will receive the same project grade. From a grading perspective, the main criteria for a successful project include
- Evidence that you have learned material taught in the course. While you are encouraged to try occasional statistical methods beyond those taught in the course, you should emphasize your experience using tools, methods, and concepts taught in Stat 149, and incorporate them into your report.
- Evidence that you have put some time and thought into the project. It is important, in particular, to demonstrate that you have reflected on the substantive results of the modeling analyses, not just that you have mechanically applied methods without considering the meaning of the results. Avoid rushing through the project as this will produce a sloppy report.
- Clarity of your written summary and correctness of the content. When writing your summary, you should make sure your explanations are clear, and that you are using correct notation and terminology in describing your modeling and methods used. Your notation and terminology should be consistent with that developed in Stat 149 this semester, not with another course that used different notation.